Introduction
Inventory management is a key operational process in e-commerce that directly impacts cash flow, customer satisfaction, and business scalability. Inventory ties up working capital, creates storage costs, and determines service levels. Mistakes in inventory management quickly transform into stockouts, lost sales, falling Customer Lifetime Value, or overstocking, frozen capital, and write-offs.
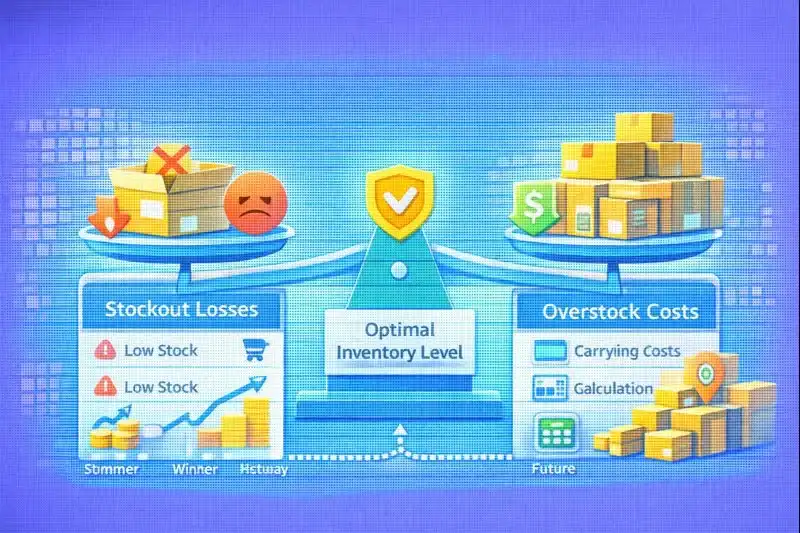
E-commerce businesses constantly balance between two risks: product unavailability when demand occurs or excess inventory that doesn't sell. Both scenarios have serious financial consequences. According to retail industry research, insufficient inventory causes 8-12% annual revenue loss, while excess inventory freezes 20-30% of working capital.
A properly built inventory management system ensures operational predictability, operational cost reduction, stable service levels, and quick demand response capability. ROI on inventory management investments grows with sales volume – the larger the business, the more critical inventory optimization becomes.

Fundamental Inventory Management Concepts
Stock Keeping Unit (SKU)
SKU (Stock Keeping Unit) is a unique product accounting unit in the system. Each combination of product, variation (size, color, configuration), and packaging has its own unique SKU.
Best practices for SKU:
- Readable structure (not random numbers)
- Uniqueness (no duplicates)
- Scalability (ability to add new products)
- Supplier integration (if supplier codes exist)
Lead Time and Its Impact
Lead time is the period from placing a supplier order to product arrival at warehouse ready for sale. Lead time includes:
- Order processing – supplier order processing (1-3 days)
- Production/picking – manufacturing or picking (varies)
- Transportation – shipping (distance dependent)
- Customs – customs clearance for imports (3-7 days)
- Receiving and inspection – warehouse receiving and inspection (1-2 days)
Example:
- Local supplier: 5-7 days
- European supplier: 14-21 days
- Asian supplier: 30-45 days
Unstable lead time complicates planning and increases safety stock needs. Close connection between lead time and logistics detailed in Delivery and Logistics article.
Reorder Point Formula
Reorder Point = (Average Daily Sales × Lead Time in Days) + Safety Stock
Example:
- Average sales: 20 units/day
- Lead time: 10 days
- Safety stock: 50 units
Reorder Point = (20 × 10) + 50 = 250 units
Safety Stock Calculation
Safety Stock = (Max Daily Usage × Max Lead Time) - (Avg Daily Usage × Avg Lead Time)
Example:
- Avg Daily Usage: 40
- Max Daily Usage: 60
- Avg Lead Time: 5 days
- Max Lead Time: 7 days
Safety Stock = (60 × 7) - (40 × 5) = 420 - 200 = 220 units
Stock Turnover Rate
Stock Turnover = Cost of Goods Sold (COGS) / Average Inventory Value
Example:
- COGS per year: $120,000
- Average inventory: $20,000
Stock Turnover = 120,000 / 20,000 = 6 times per year
Industry benchmarks:
- Fashion/Apparel: 4-6 times
- Electronics: 6-8 times
- FMCG/Food: 10-15 times
- Jewelry/Luxury: 2-4 times
ABC Analysis: Inventory Prioritization
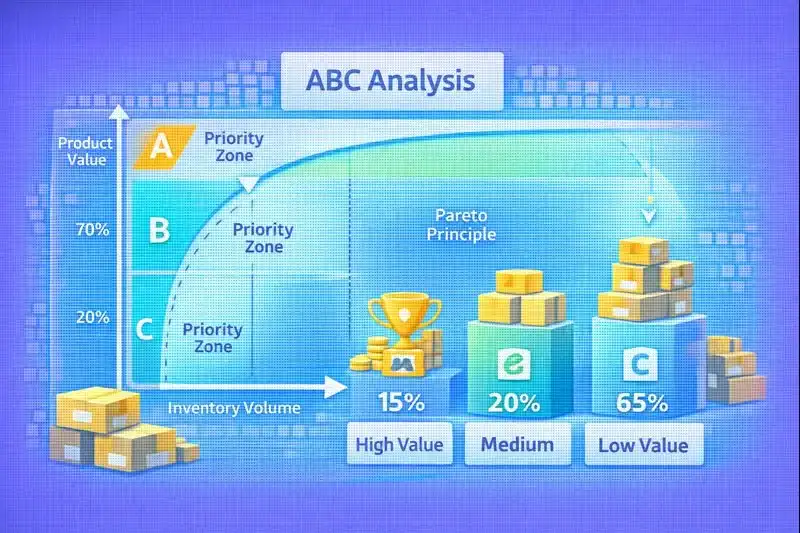
ABC analysis is a fundamental inventory management tool based on the Pareto principle: a small portion of products generates the majority of revenue.
ABC Classification Concept
Category A (High Value):
- 15-20% of all SKUs
- Generate 70-80% of revenue
- Critical for business
- Require most attention
Category B (Medium Value):
- 25-35% SKUs
- Generate 15-20% revenue
- Moderate importance
- Standard management
Category C (Low Value):
- 45-60% SKUs
- Generate only 5-10% revenue
- Low priority
- Minimal effort
Different Strategies for A, B, C Categories
| Aspect | Category A | Category B | Category C |
|---|---|---|---|
| Monitoring | Daily | Weekly | Monthly |
| Reorder frequency | High (2-4 weeks) | Medium (1-2 months) | Low (quarterly) |
| Safety stock | High (20-30 days) | Medium (10-15 days) | Low (5-7 days) |
| Forecasting method | Advanced (ML) | Statistical | Simple averages |
| Service level target | 98-99% | 95% | 90% |
Economic Order Quantity (EOQ)
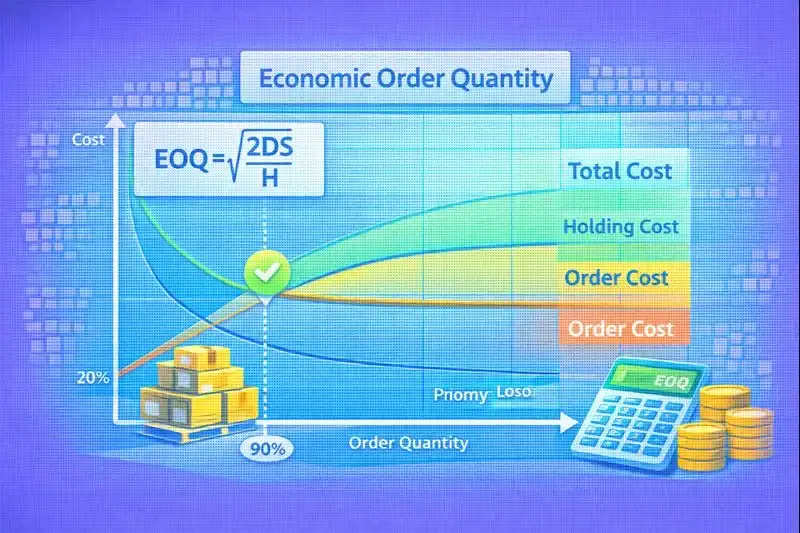
Economic Order Quantity (EOQ) is a classic inventory management model determining optimal order size that minimizes total inventory costs.
EOQ Formula
EOQ = √((2 × Annual Demand × Order Cost) / Holding Cost per Unit per Year)
Practical Example
Given:
- Annual Demand: 12,000 units
- Order Cost: $25 per order
- Unit Cost: $5
- Holding Cost Rate: 20% annually ($1 per unit per year)
Calculation:
EOQ = √((2 × 12,000 × 25) / 1)
EOQ = √(600,000)
EOQ ≈ 775 units
Interpretation:
Optimal order size: 775 units
Orders per year:
Number of Orders = 12,000 / 775 ≈ 15.5 orders per year
Days Between Orders ≈ 24 days
When EOQ Works Well
EOQ is effective when:
- ✅ Stable demand (low variability)
- ✅ Constant costs (ordering and holding don't change)
- ✅ Instant replenishment (lead time not considered)
- ✅ Single product or independent products
- ✅ No quantity discounts from supplier
Inventory Management Methods
| Method | Essence | Advantages | Limitations | Best For |
|---|---|---|---|---|
| JIT | Minimal inventory | Low carrying costs | Stockout risk | High-volume, reliable suppliers |
| FIFO | First-In-First-Out | Quality control | Requires layout | Perishables, dated products |
| LIFO | Last-In-First-Out | Logistics simplicity | Write-off risk | Non-perishables |
| Dropshipping | No owned warehouse | Minimal capital | Service control | Testing products |
| Consignment | Supplier-owned inventory | Low risk | Limited suppliers | High-value products |
| VMI | Vendor-managed | Optimization | Loss of control | Strategic partnerships |
Demand Forecasting

Forecasting Methods
1. Historical Averages Simple method – average sales over past periods.
2. Moving Averages Average of last N periods, window "moves" forward.
3. Exponential Smoothing Gives more weight to recent data.
4. Machine Learning Advanced techniques: ARIMA, Prophet, LSTM neural networks.
Benefits:
- Considers multiple factors (weather, holidays, campaigns)
- Adapts to complex patterns
- Continuously improves
Warehouse Organization
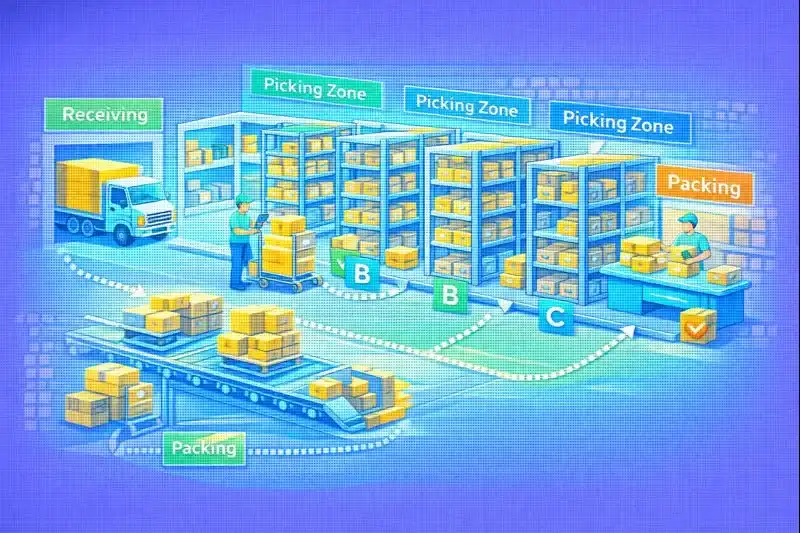
| Zone | Function | Optimization |
|---|---|---|
| Receiving | Product receiving | Quick QC control |
| Storage | Inventory storage | ABC slotting |
| Picking | Order fulfillment | Short paths |
| Packing | Shipping preparation | Standards |
| Shipping | Customer shipping | Cross-docking |
ABC Slotting Optimization
Principle: Place fast-moving products (Category A) closest to packing zone to minimize travel time.
Impact: 30-50% reduction in picking time.
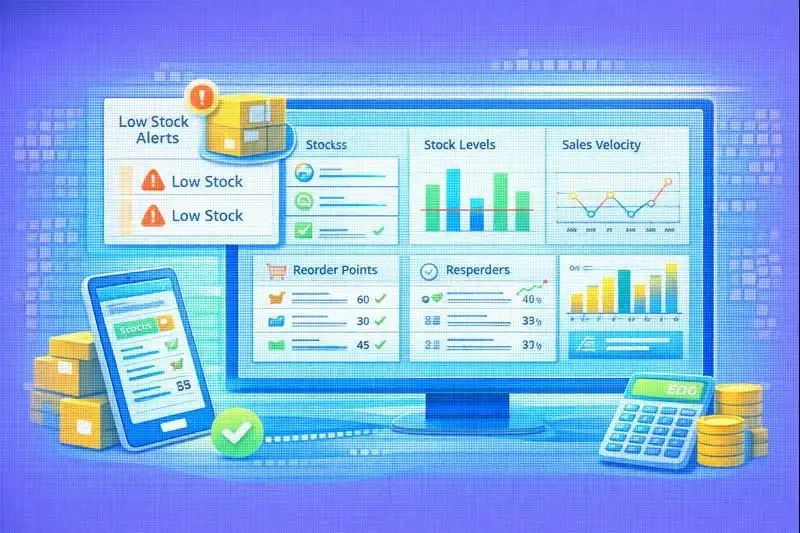
Inventory Management Software
System Types
1. Standalone Inventory Software Dedicated inventory management platform.
2. ERP-Integrated Systems Inventory module as part of Enterprise Resource Planning system.
3. E-commerce Native Inventory Inventory management built into e-commerce platform.
Key Features
- Real-time stock tracking
- Automated reorder points
- Multi-location support
- Barcode/SKU scanning
- Forecasting tools
- Reporting & analytics
- Integration capabilities
- Mobile app
Integration approaches detailed in Marketing Automation article.
Metrics and KPIs
| KPI | Formula | Benchmark |
|---|---|---|
| Inventory Turnover | COGS / Avg Inventory | 4–8 |
| Days Sales Inventory | (Avg Inventory / COGS) × 365 | <90 |
| Stockout Rate | Stockouts / Orders | <2% |
| Carrying Cost % | Carrying Cost / Avg Inventory | 20-30% |
Inventory Turnover Example
Inventory Turnover = $150,000 COGS / $25,000 Avg Inventory = 6 times/year
Inventory completely turns over every 2 months (12 / 6 = 2).
Days Sales of Inventory (DSI)
DSI = ($25,000 / $150,000) × 365 = 61 days
Average product sits 61 days before sale.
Multi-Channel Inventory
Selling through multiple channels (own website, marketplaces, social, offline) creates inventory management complexity.
Synchronization Strategies
1. Real-time synchronization (best)
- Central inventory system
- API integration with all channels
- Sale on channel A → instant update on channels B, C, D
2. Reserved inventory per channel
- Simple but less efficient
3. Manual updates (worst)
- Error-prone, lag time
Financial Impact
Working Capital Tied in Inventory
Example: $25,000 in inventory.
Opportunity cost: Could invest in:
- Marketing (10-20% ROMI) → $2,500-5,000 additional profit
- New products → assortment expansion
- Technology → automation
Storage Costs
Monthly warehouse costs for 100 m²:
- Rent: $1,000
- Utilities: $150
- Security: $100
- Insurance: $75
- Total: $1,325/month = $15,900/year
For $50,000 average inventory: Storage 32% of inventory value
Common Mistakes
- Manual tracking – Excel spreadsheets instead of software
- No demand forecasting – gut feeling orders
- Ignoring carrying costs – not calculating true costs
- Poor supplier relationships – transactional approach
- Lack of safety stock – no buffer for variability
- One-size-fits-all – same strategy for all products
Inventory for Different Business Types
Startup (<100 orders/month):
- Manual tracking possible
- Spreadsheets
- Cash flow focus
Growing (100-500 orders/month):
- Inventory software needed
- Basic automation
- ABC analysis
Scale-up (500+ orders/month):
- Advanced systems (ERP)
- Warehouse automation
- Multi-location
FAQ
1. How much inventory to hold? Depends on service level target and turnover goals. Generally: lead time coverage + safety stock, not exceeding 90 days supply.
2. How to calculate reorder point? Reorder Point = (Avg Daily Sales × Lead Time) + Safety Stock
3. Dropshipping vs own inventory? Dropshipping for testing and wide assortment. Own inventory for proven bestsellers and faster shipping.
4. What software to use? Small business: E-commerce native. Growing: Standalone systems. Scale-up: ERP or LetsCommerce advanced module.
5. How to reduce carrying costs? Improve turnover, negotiate warehouse costs, reduce safety stock intelligently, liquidate dead stock.
6. What to do with slow-moving inventory? Promotions, repositioning, liquidation, donation. Prevention: test in small quantities, monitor sell-through.
7. How to automate reordering? Configure reorder points, set EOQ, define rules, test in pilot mode, monitor performance, scale to full automation.
8. How to balance inventory across channels? Dynamic real-time sync (best), channel-reserved (simple), or priority-based (balanced).
Conclusion
Inventory management is not just an operational function, it's a strategic capability directly impacting financial health, customer satisfaction, and e-commerce business scalability.
Key takeaways:
- Balance is key – between service level and carrying costs
- Data-driven decisions – use mathematical models instead of gut feeling
- ABC prioritization – not all products are equal
- Technology enablement – software and automation critical for scaling
- Continuous optimization – regularly review metrics, adjust strategies
LetsCommerce Platform:
LetsCommerce provides comprehensive inventory management tools:
- Real-time tracking across locations and channels
- Automated reordering with smart reorder points
- Built-in ABC analysis
- Demand forecasting using historical data and ML
- Multi-channel sync prevents overselling
- Integration with logistics operators
- Mobile app for warehouse management
- Automated alerts for low stock, slow movers
- Returns integration with returns management system
Inventory Audit Checklist
Data and Tracking:
- Inventory system in place
- Real-time stock visibility
- Accurate SKU structure
- Barcode system implemented
Planning and Forecasting:
- Demand forecasting process
- Historical sales analyzed
- Reorder points calculated
- Safety stock levels defined
Financial Management:
- Carrying costs calculated
- Inventory turnover tracked
- Dead stock identification
- Target turnover defined
Technology:
- Automated reordering
- Low stock alerts
- Mobile capabilities
- Analytics dashboards
Related Articles
- Delivery and Logistics – how lead time and fulfillment integration impact inventory management
- Customer Lifetime Value – stockout impact on retention and LTV
- Returns Management – reverse logistics, returned inventory handling
- Marketing Automation – back-in-stock notifications automation
- Email Marketing – inventory-driven email campaigns

Ready to start selling?
Launch your online store today with LetsCommerce.