Introduction
E-commerce in 2025 operates under rising traffic costs, declining user attention, and stricter privacy requirements. Teams win markets through number control, not intuition. Analytics transforms a store into a system: you see where margin is lost, where the funnel breaks, which channels acquire "bad" customers, and which logistics processes consume profit.
McKinsey describes "data-driven enterprise" as a model where data shapes operational decisions and drives measurable results. Companies already generating 20% EBIT from AI more frequently implement mature data practices (McKinsey, 2024). Shopify emphasizes: e-commerce teams use analytics for faster decision-making, inventory optimization, and conversion improvement (Shopify, 2024).
Below is a practical guide: which KPIs to track, how to calculate them, which benchmarks to use, and how to build a KPI dashboard for store management.
Revenue and Sales Metrics
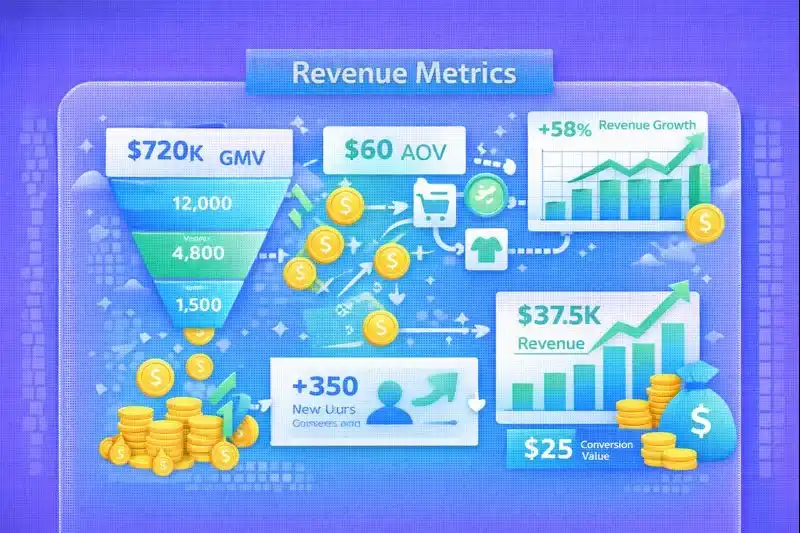
Revenue metrics show "how much" the store earns. Without them, you cannot properly evaluate marketing, catalog efficiency, or logistics.
Shopify provides conversion benchmarks for e-commerce, where average values vary and many stores see 1.4% as a baseline on the platform (Shopify, 2024). Oberlo reminds: AOV is calculated as revenue divided by order count (Oberlo, 2024).
Revenue Metrics, Formulas, Benchmarks:
| Metric | Purpose | Formula | Average Benchmark | Good | Excellent |
|---|---|---|---|---|---|
| GMV | Sales scale | GMV = Σ(price × quantity) | varies by niche | +10% YoY | +20% YoY |
| Revenue (Net) | Actual revenue | Revenue = GMV – discounts – returns – taxes | varies by niche | stable growth | stable growth + margin |
| AOV | Average order value | AOV = Revenue / Orders | varies by niche | +10% YoY | +20% YoY |
| Items per Order | Cart completeness | Items/Order = Items Sold / Orders | 1.2–1.8 | 1.8–2.3 | 2.3+ |
| Gross Profit | Gross profit | Gross Profit = Revenue – COGS | varies by niche | grows with Revenue | grows faster than Revenue |
| Gross Margin | Margin quality | Gross Margin = (Gross Profit / Revenue) × 100% | 30–50% | 50–65% | 65%+ |
Formulas with Examples:
AOV:
Formula:
AOV = Revenue / Orders

Example:
AOV = ($120,000 / 8,000 orders) = $15
Gross Margin:
Formula:
Gross Margin = (Gross Profit / Revenue) × 100%

Example:
Gross Margin = ($42,000 / $120,000) × 100% = 35%
Practice:
- Calculate Revenue "after returns". Returns directly cause gaps between GMV and actual revenue.
- Add Gross Margin by category. Marketing often "wins" in Revenue but loses in profit.
Revenue Control Checklist:
- Separate GMV, Net Revenue, Gross Profit in reports
- Calculate AOV by channels, categories, countries
- Add Gross Margin by SKU and categories
- Separate "profitable" orders from "unprofitable" after delivery and returns
Conversion Metrics
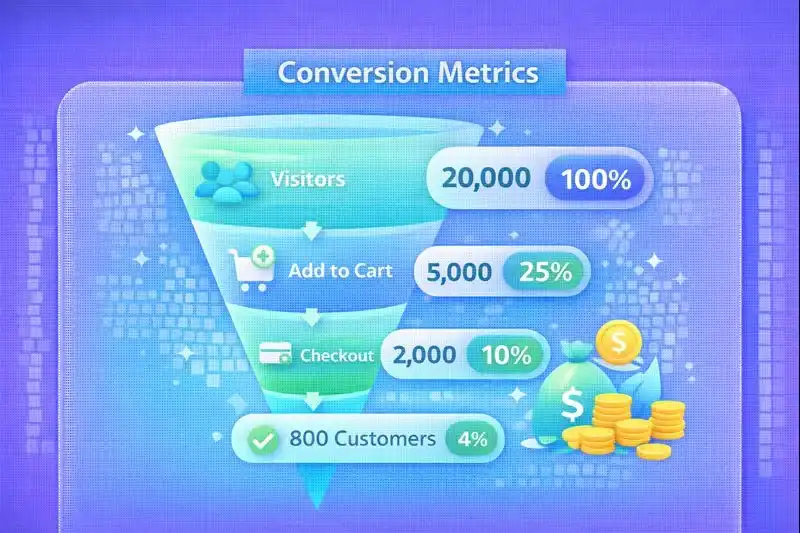
Conversion shows how effectively the store transforms visitors into buyers. You can drive more traffic, but low conversion causes economic failure.
Shopify describes average conversion benchmarks, where a "healthy" range often hovers around 2.5–3%, while many stores have lower values (Shopify, 2024). Baymard Institute records 69.99% abandoned carts as the average (Baymard Institute, 2024).
Conversion Metrics, Formulas, Benchmarks:
| Metric | Formula | Average | Good | Excellent |
|---|---|---|---|---|
| Conversion Rate | (Orders / Sessions) × 100% | 1–2% | 2–3% | 4%+ |
| Add-to-Cart Rate | (Add to Cart Events / Sessions) × 100% | 4–8% | 8–12% | 12%+ |
| Cart-to-Purchase Rate | (Orders / Carts Created) × 100% | 25–35% | 35–45% | 45%+ |
| Checkout Abandonment Rate | (Abandoned Checkouts / Initiated Checkouts) × 100% | 45–60% | 35–45% | <35% |
| Cart Abandonment Rate | 100% – Cart-to-Purchase Rate | ~70% | 60% | <50% |
Formula and Example:
Conversion Rate:
Formula:
Conversion Rate = (Orders / Sessions) × 100%

Example:
Conversion Rate = (1,500 / 50,000) × 100% = 3%
Checkout Abandonment Rate:
Formula:
Checkout Abandonment Rate = (Abandoned Checkouts / Initiated Checkouts) × 100%

Example:
Checkout Abandonment Rate = (900 / 1,800) × 100% = 50%
Practice: "where the funnel drops":
- Add-to-Cart low – product, price, trust, product page UX problem
- Cart-to-Purchase low – shipping, payments, promo codes, final price transparency problem
- Checkout Abandonment high – speed, forms, errors, payment step "surprises" problem
Conversion Optimization Checklist:
- Build funnel: view → add_to_cart → checkout_start → purchase
- Add payment error, rejection, shipping unavailability events
- Check mobile checkout – most rejections occur there
- Track time-to-purchase (minutes-to-purchase) by channels
Customer Metrics
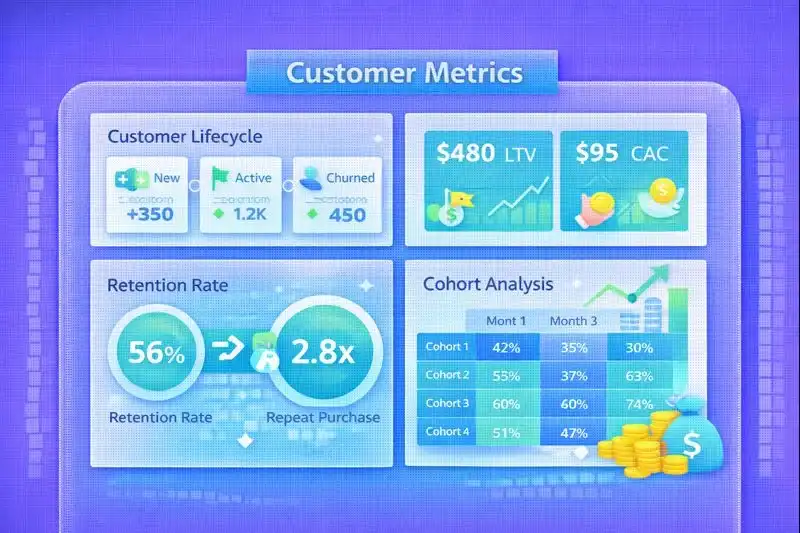
Customer metrics answer questions: who buys, how much acquisition costs, how much a customer brings over the entire cycle.
In e-commerce practice, marketing "wins" through cheap CAC, but business loses through low LTV. That's why the LTV:CAC ratio determines model health.
BigCommerce emphasizes the importance of LTV and retention as the "core" of measurement (BigCommerce, 2024). McKinsey describes the personalization effect, which drives 5–15% revenue growth for leaders (McKinsey, 2024).
Customer Metrics, Formulas, Benchmarks:
| Metric | Formula | Average | Good | Excellent |
|---|---|---|---|---|
| LTV | AOV × Purchase Frequency × Lifespan | varies by niche | grows YoY | grows faster than CAC |
| CAC | Total Marketing Spend / New Customers | varies by niche | decreases YoY | stable with growth |
| LTV:CAC | LTV / CAC | 2:1 | 3:1 | 5:1+ |
| Retention Rate | ((Customers End – New Customers) / Customers Start) × 100% | 20–35% | 35–50% | 50%+ |
| Repeat Purchase Rate | (Repeat Customers / Total Customers) × 100% | 20–30% | 30–40% | 40%+ |
| Churn Rate | (Lost Customers / Total Customers) × 100% | 30–50% | 20–30% | <20% |
Formulas with Examples:
CAC:
Formula:
CAC = Total Marketing Spend / New Customers Acquired

Example:
CAC = ($30,000 / 2,000 new customers) = $15
LTV:CAC:
Formula:
LTV:CAC = LTV / CAC

Example:
LTV:CAC = ($90 / $15) = 6:1
Practice:
- Calculate LTV by cohort: first purchase month → LTV at 30/90/180 days.
- Add "margin LTV": LTV on gross profit, not revenue.
- Separate retention by category: consumables often drive stronger repeat.
Customer Analytics Checklist:
- Build 30/90/180 day cohorts
- Calculate LTV by acquisition channels
- Add VIP segmentation (top 10% by LTV)
- Set LTV:CAC ≥ 3:1 target in budget planning
Traffic and Acquisition Metrics
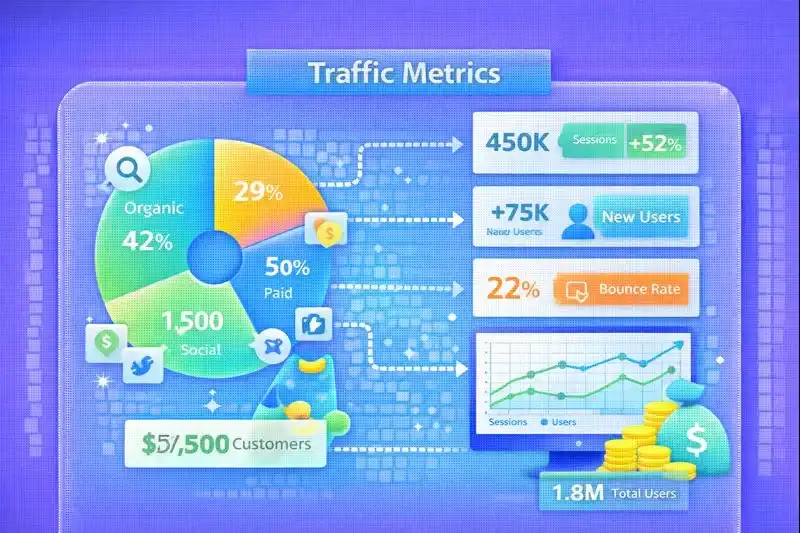
Traffic itself doesn't guarantee sales. Engagement metrics show audience quality, intent, and offer relevance.
Google Analytics 4 defines engagement rate and bounce rate as basic interaction metrics (Google, 2024). Databox publishes GA4 industry benchmarks for engagement and conversions, useful for comparison (Databox, 2024).
Traffic Metrics, Formulas, Benchmarks:
| Metric | Formula | Average | Good | Excellent |
|---|---|---|---|---|
| Sessions | counter | depends on budget | stable growth | growth + quality |
| Users | counter | varies by niche | growth YoY | growth YoY |
| Engagement Rate (GA4) | Engaged Sessions / Sessions × 100% | 45–55% | 55–65% | 65%+ |
| Bounce Rate (GA4) | 100% – Engagement Rate | 45–55% | 35–45% | <35% |
| Pages per Session | Pageviews / Sessions | 2–3 | 3–4 | 4+ |
| Traffic Source Share | Channel Sessions / Sessions × 100% | balance | diversified | strong organic + brand |
Calculation Example:
Engagement Rate:
Formula:
Engagement Rate = (Engaged Sessions / Sessions) × 100%

Example:
Engagement Rate = (27,000 / 50,000) × 100% = 54%
Practice:
- Track "Revenue per Session" by channels. High traffic without revenue causes planning noise.
- Compare engagement and conversion together. High engagement without purchase signals a checkout barrier.
Marketing Metrics
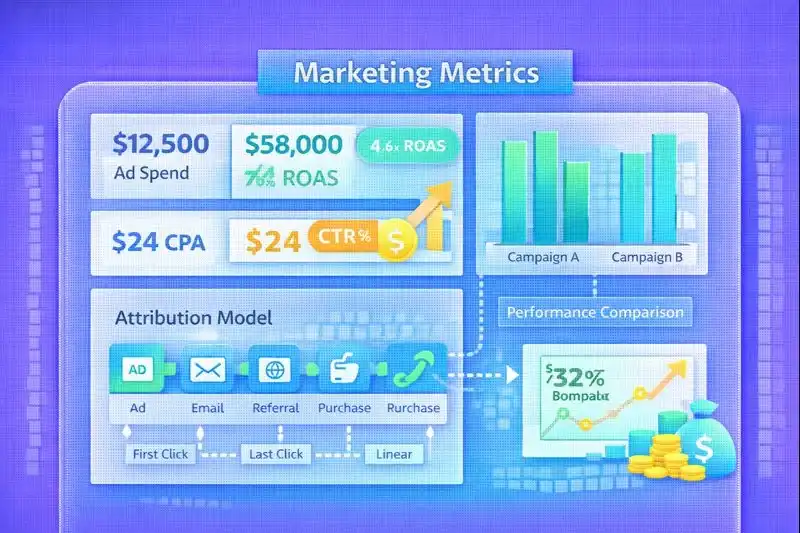
Marketing metrics show acquisition spend efficiency, creative quality, and ability to scale sales without margin decline.
WordStream publishes Google Ads Benchmarks 2024 for CTR, CPC, conversion rate by industry (WordStream, 2024). Klaviyo provides email benchmarks, including open rate and click rate by industry (Klaviyo, 2024).
Marketing Metrics, Formulas, Benchmarks:
| Metric | Formula | Average | Good | Excellent |
|---|---|---|---|---|
| ROAS | Revenue from Ads / Ad Spend | 2.0 | 3.0 | 5.0+ |
| CPA | Ad Spend / Conversions | varies by niche | down YoY | down YoY while scaling |
| CPO | Total Marketing Cost / Orders | varies by niche | margin control | margin control + growth |
| CTR | (Clicks / Impressions) × 100% | 2–4% | 4–6% | 6%+ |
| Email Open Rate | (Opens / Delivered) × 100% | 15–20% | 25% | 35%+ |
| Email Click Rate | (Clicks / Delivered) × 100% | 1.5–2.5% | 2.5–3.5% | 3.5%+ |
Formulas with Examples:
ROAS:
Formula:
ROAS = Revenue from Ads / Ad Spend

Example:
ROAS = ($90,000 / $30,000) = 3.0
CTR:
Formula:
CTR = (Clicks / Impressions) × 100%

Example:
CTR = (12,000 / 300,000) × 100% = 4%
Practice: attribution:
- Use unified UTM standards.
- Maintain "Contribution margin by channel" report: gross profit minus channel costs.
- Compare ROAS vs LTV-based ROAS for paid channels.
Marketing Analytics Checklist:
- Calculate ROAS in revenue and gross profit
- Separate brand vs non-brand in Search
- Calculate CAC by channels, compare with cohort LTV
- Implement holdout test for email or remarketing
Product and Catalog Metrics
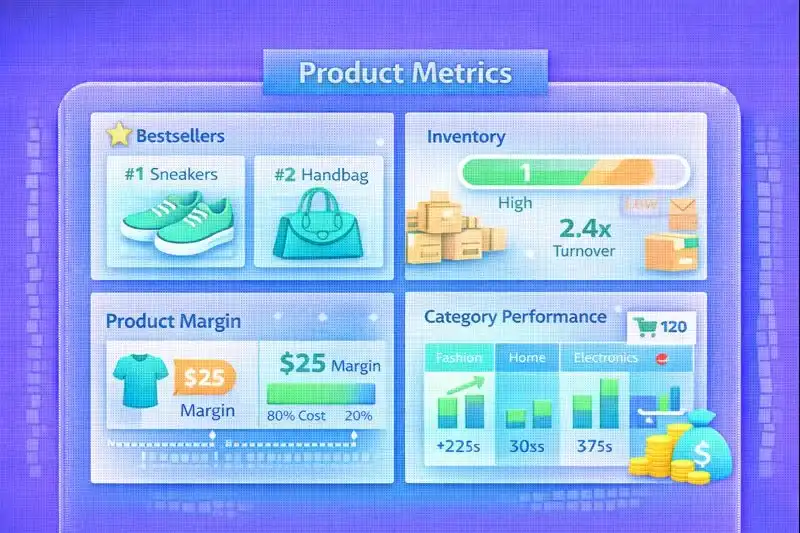
Catalog determines e-commerce success or failure. Product metrics show which SKUs sell, which get stuck in inventory, and which categories deliver margin.
BigCommerce recommends tracking AOV, conversion rate, traffic, LTV, retention as a basic set easily detailed by product groups (BigCommerce, 2024). Shopify emphasizes the role of analytics for inventory, demand, and assortment (Shopify, 2024).
Catalog, Inventory, Margin:
| Metric | Formula | Average | Good | Excellent |
|---|---|---|---|---|
| Sell-through Rate | (Units Sold / Units Received) × 100% | 20–40% | 40–60% | 60%+ |
| Inventory Turnover | COGS / Avg Inventory | 4–6 | 6–10 | 10+ |
| Product Margin | (Price – COGS) / Price × 100% | 30–50% | 50–65% | 65%+ |
| Category Share | Category Revenue / Total Revenue × 100% | balance | managed focus | managed focus + margin |
| Contribution by SKU | Gross Profit – Ads – Returns – Shipping | varies | positive | high |
Example:
Sell-through Rate:
Formula:
Sell-through Rate = (Units Sold / Units Received) × 100%

Example:
Sell-through Rate = (600 / 1,200) × 100% = 50%
Practice:
- Create ABC analysis by margin revenue.
- Enable "product performance by traffic": sessions → conversion → margin by SKU.
- Control "out of stock rate" on top SKUs. Stock absence causes organic and paid demand loss.
Operational Metrics
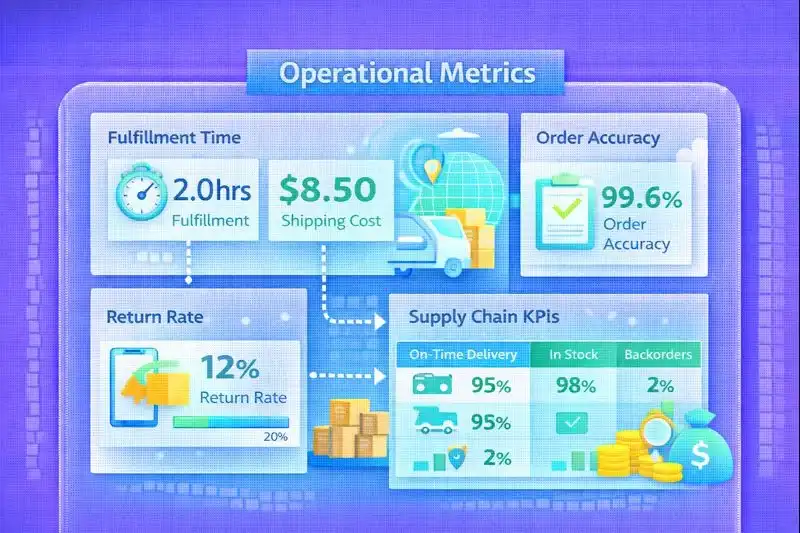
Operations directly impact profit. Shipping, fulfillment, returns often "consume" margin invisibly to marketing.
Shopify references NRF/Happy Returns data: average e-commerce return rate in 2024 – 16.9% (Shopify, 2024). Baymard shows the scale of abandonment problem directly linked to shipping and payment surprises at checkout (Baymard Institute, 2024).
Operational Metrics, Formulas, Benchmarks:
| Metric | Formula | Average | Good | Excellent |
|---|---|---|---|---|
| Fulfillment Time | time from order to shipment | 24–72 hrs | <24 hrs | same-day |
| Shipping Cost per Order | Shipping Cost / Orders | varies | down YoY | down YoY with growth |
| Return Rate | (Returns / Orders) × 100% | 15–20% | 10–15% | <10% |
| Order Accuracy Rate | (Accurate Orders / Total Orders) × 100% | 97–98% | 98–99% | 99%+ |
| Support Tickets per 100 Orders | Tickets / Orders × 100 | 3–6 | 1–3 | <1 |
Formula and Example:
Return Rate:
Formula:
Return Rate = (Returns / Orders) × 100%

Example:
Return Rate = (170 / 1,000) × 100% = 17%
Practice:
- Calculate "return cost": reverse logistics + processing + markdown + lost margin.
- Track return reasons by category (size, quality, expectations vs reality).
- Track accuracy by warehouse – fulfillment errors cause returns, negative reviews, LTV loss.
Operational Control Checklist:
- Track Return Rate by categories, brands, sizes
- Maintain fulfillment and delivery SLA by carriers
- Calculate cost-to-serve per order: shipping + support + returns
- Add alerts for return increases, accuracy drops
Analytics Tools

Tools determine KPI access speed and data quality.
GA4 provides standard engagement, conversion, attribution, audience metrics (Google, 2024). Analyzify describes benchmarking in GA4 as a way to compare with the market, including dozens of metrics (Analyzify, 2024).
Tools and Role in KPI System:
| Layer | Tools | Purpose | Risks |
|---|---|---|---|
| Web analytics | GA4 | sessions, funnels, attribution | sampling, event setup |
| Store platform | e-commerce admin | orders, margin, inventory | data fragmentation |
| BI | Looker Studio, Power BI, Tableau | dashboards, segmentation | maintenance complexity |
| DWH | BigQuery, Snowflake | "single source of truth" | cost, engineering |
| CDP | Segment, mParticle | events, identity | requires schema discipline |
Integration Practice:
- Unified event schema:
product_view,add_to_cart,begin_checkout,purchase,refund. - Unified identifiers:
customer_id,order_id,product_id. - Unified UTM standard:
utm_source,utm_medium,utm_campaign.
How to Build a KPI Dashboard
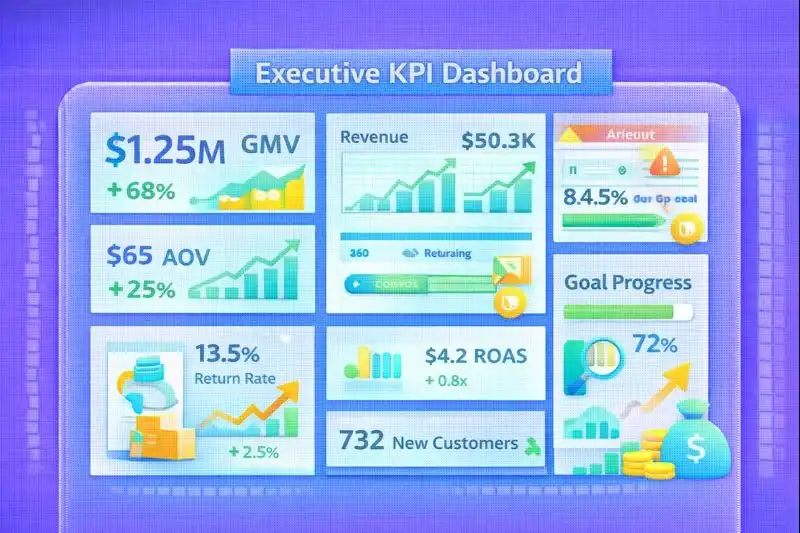
A KPI dashboard is a team management tool. It should answer 3 questions: how the store earns, where it loses, what to do today.
Databox demonstrates the approach to comparing GA4 metrics with industries, helping set realistic goals (Databox, 2024). Shopify emphasizes: analytics drives better decisions on marketing, assortment, inventory (Shopify, 2024).
Dashboard Structure (Recommendation):
| Block | KPI | Update Frequency | Owner |
|---|---|---|---|
| Executive | Revenue, Gross Profit, Gross Margin | daily | CEO/COO |
| Funnel | CR, ATC, Checkout completion | daily | Product |
| Marketing | ROAS, CAC, CPO, CTR | daily | Marketing |
| Customer | LTV, Retention, Repeat | weekly | Growth |
| Catalog | Sell-through, Turnover, Margin | weekly | Merch |
| Ops | Returns, Fulfillment, Accuracy | daily/weekly | Ops |
Alerts That Save Margin:
- CR drops 15% day-over-day
- Return Rate grows 3 p.p. week-over-week
- ROAS drops below target
- Out-of-stock on top 20 SKUs
- Checkout errors grow above norm
KPI Dashboard Launch Checklist:
- Define 10–15 KPIs "on the first screen"
- Add Good/Excellent thresholds, alerts
- Break down KPIs by channels, countries, categories
- Create "metrics dictionary": definition, formula, source
- Implement weekly KPI review with decisions
Benchmarks Table
| Metric | Average | Good | Excellent |
|---|---|---|---|
| Conversion Rate | 1-2% | 2-3% | 4%+ |
| AOV | varies | +10% YoY | +20% YoY |
| Cart Abandonment | 70% | 60% | <50% |
| LTV:CAC | 2:1 | 3:1 | 5:1+ |
| Return Rate | 20-30% | 15% | <10% |
| Email Open Rate | 15-20% | 25% | 35%+ |
Frequently Asked Questions
Which KPIs are more important – conversion or AOV?
Conversion affects order volume. AOV affects revenue per order. The store wins when the team manages both metrics through one margin model: CR × AOV × Gross Margin. Optimize both in parallel, measuring impact on gross profit.
How to quickly spot checkout problems?
Track Checkout Completion, Checkout Abandonment, payment errors, checkout completion time. Baymard shows high abandonment levels – 69.99%, so minor friction causes major losses. Add events for each checkout step and monitor drops between steps.
What LTV:CAC is considered healthy?
Target – 3:1 or higher. Below 2:1 creates dependency on constant budget growth and increases cash flow risks. Calculate LTV on gross profit, not revenue, to see the real picture.
How to calculate ROAS correctly?
Start with ROAS on revenue, then add ROAS on gross profit. The formula is simple: ROAS = Revenue from Ads / Ad Spend. WordStream provides Google Ads industry benchmarks for CTR and conversions, helping evaluate campaign quality. Target – ROAS ≥ 3.0, but depends on category margin.
Which metrics most often "break" profit invisibly?
Return Rate, Shipping Cost per Order, Order Accuracy. Shopify reports average return rate in 2024 – 16.9%, returns directly cause margin loss. Track return reasons, reverse logistics costs, and fulfillment errors – these are "hidden" costs that destroy unit economics.
Related Articles
- CRO for E-commerce — How to increase conversion at every funnel stage
- A/B Testing — How to make data-driven decisions
- Google Ads for E-commerce — Performance Max and Shopping setup
- Email Marketing — Funnels, triggers, and segmentation
Conclusion
KPIs in 2025 are not "reporting" but a profit management tool. Start with the base: Revenue, Gross Profit, Gross Margin, CR, AOV, LTV, CAC, ROAS, Return Rate. Then add detail by channels, categories, cohorts. Build a dashboard with alerts, metrics dictionary, and regular review process.
E-commerce KPI Priorities:
- Revenue — Revenue, Gross Profit, Gross Margin
- Conversion — CR, Add-to-Cart, Checkout Completion
- Customers — LTV, CAC, LTV:CAC, Retention
- Marketing — ROAS, CPA, CTR
- Operations — Return Rate, Fulfillment Time, Accuracy
- Catalog — Sell-through, Turnover, Product Margin
Success Formula: Right Metrics + Regular Review + Fast Decisions = Managed Profit.
LetsCommerce provides built-in analytics with key KPIs for your store — track conversion, AOV, LTV, and other metrics in real time without additional integrations.

Ready to start selling?
Launch your online store today with LetsCommerce.