Introduction
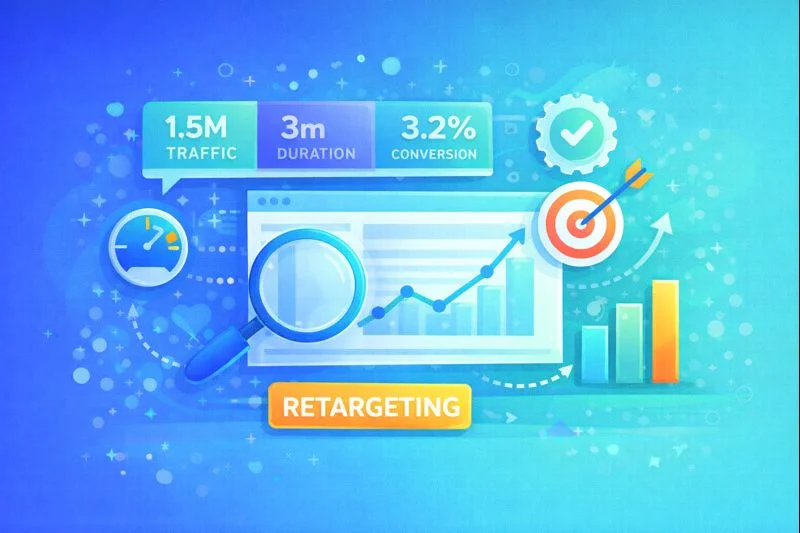
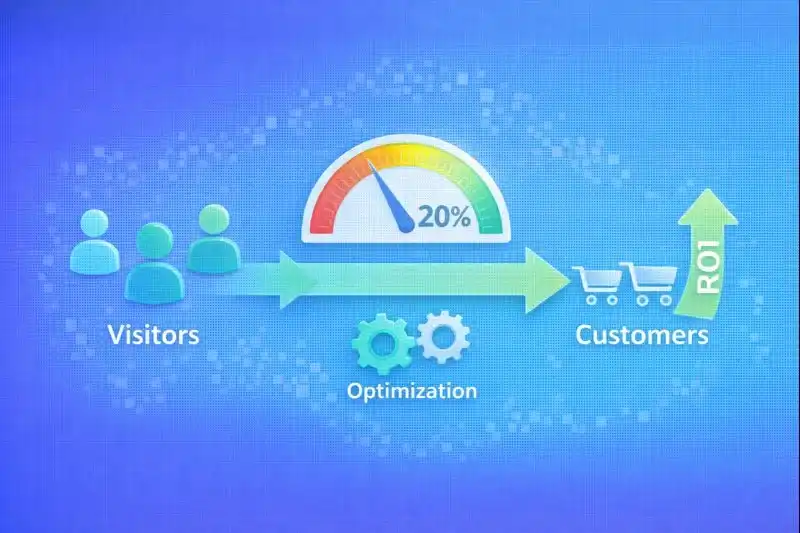
The average e-commerce conversion rate in 2024-2025 is 2-3%, meaning 97% of visitors leave without purchasing (Statista, 2024). Increasing traffic without optimizing the funnel leads to rising costs without proportional revenue growth.
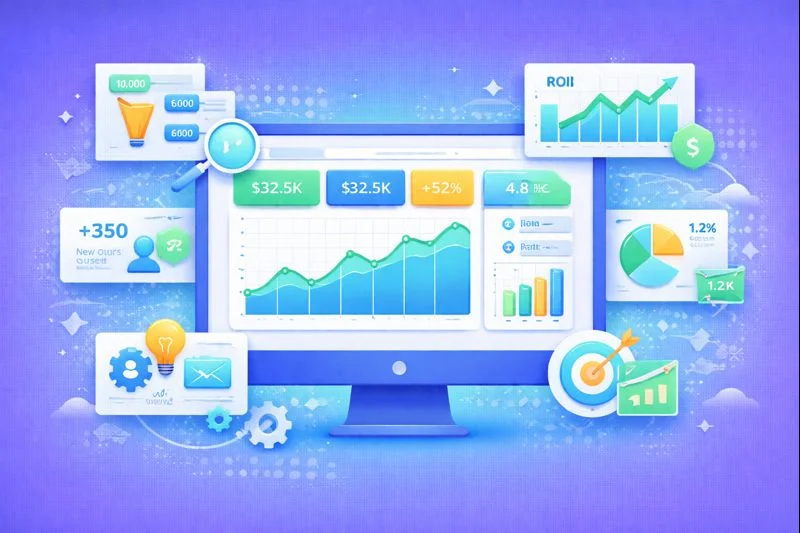
McKinsey confirms — CRO investments deliver 5-8× ROI compared to paid traffic investments (McKinsey, 2024).
CRO is systematic work to improve efficiency at every funnel stage: from the first click to successful payment. In 2025, CRO becomes a key competitive advantage for e-commerce.
What is CRO and Why It Matters
CRO (Conversion Rate Optimization) is the process of increasing the percentage of users who complete a target action: purchase, add to cart, order completion.
Key CRO Formulas:
Conversion Rate = (Conversions / Visitors) × 100%

Revenue = Traffic × Conversion Rate × AOV

CRO ROI = (Additional Revenue - CRO Costs) / CRO Costs
Example of CRO Impact:
| Metric | Before CRO | After CRO | Change |
|---|---|---|---|
| Traffic | 100,000 | 100,000 | — |
| Conversion | 2.0% | 2.6% | +30% |
| AOV | $100 | $100 | — |
| Revenue | $200,000 | $260,000 | +$60,000 |
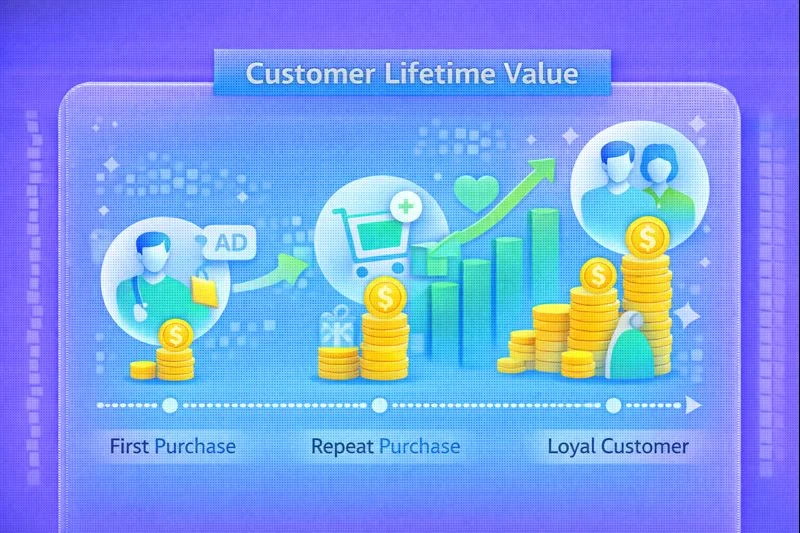
Even increasing conversion from 2% to 2.6% results in +30% revenue without increasing ad budget. Forrester confirms — CRO directly reduces CAC and increases LTV (Forrester, 2024).
CRO vs Traffic Acquisition:
- Traffic: +10% visitors = +10% ad spend
- CRO: +10% conversion = +10% revenue with no additional cost
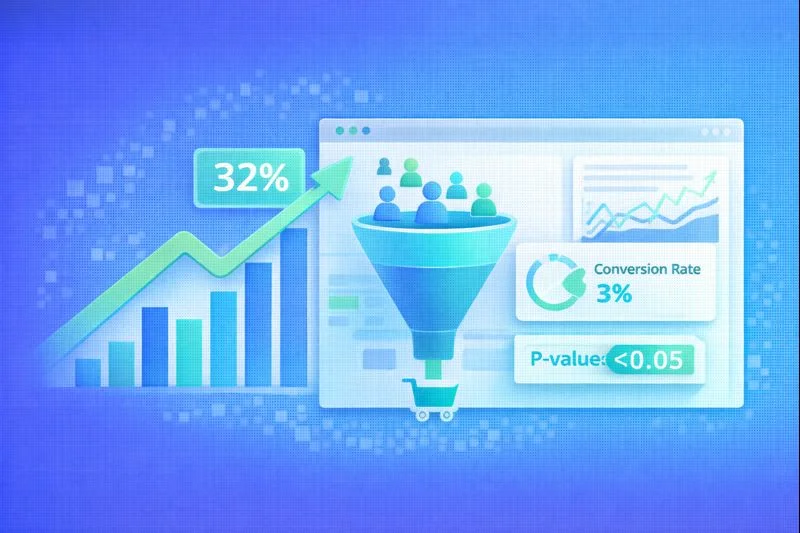
E-commerce Conversion Funnel
The classic e-commerce funnel shows where users are lost on their way to purchase.
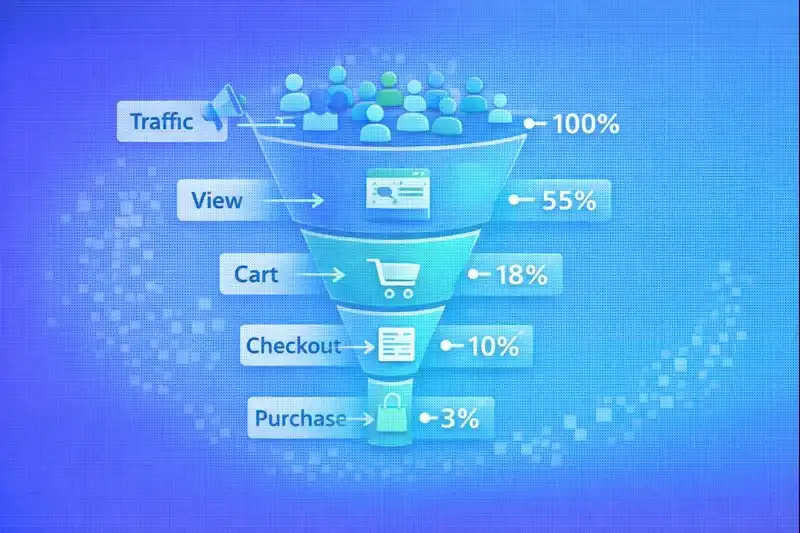
Funnel Stages and Typical Metrics:
| Stage | % of Users | Key Metric |
|---|---|---|
| Traffic | 100% | Sessions |
| Product Views | 60-70% | Product Views |
| Add to Cart | 8-12% | Add-to-Cart Rate |
| Checkout Start | 4-6% | Checkout Initiation |
| Purchase | 2-3% | Conversion Rate |
Where the Biggest Losses Occur:
- Homepage → Catalog — 30-40% bounce rate
- Catalog → Product — low CTR due to poor filters
- Product → Cart — lack of trust, unclear pricing
- Cart → Checkout — unexpected shipping costs
- Checkout → Payment — complex form, missing payment method
Every percentage improvement at any stage drives growth in the final result.
CRO Audit: Where to Start
Before optimization, you need to understand the current state. Econsultancy confirms: companies that conduct regular CRO audits have 50% higher conversion (Econsultancy, 2024).

Audit Tools:
| Tool | What It Analyzes | Examples |
|---|---|---|
| Google Analytics 4 | Funnel, metrics, segments | Free |
| Heatmaps | Clicks, scroll, attention | Hotjar, Microsoft Clarity |
| Session Recordings | Real behavior | Hotjar, FullStory |
| Surveys | User opinions | Hotjar, Typeform |
| A/B Testing | Hypothesis validation | VWO, Optimizely |
CRO Audit Checklist:
-
GA4 Analysis:
- Where does traffic come from?
- Where is the biggest drop-off?
- Which pages have high bounce rate?
-
Heatmaps:
- Where do users click?
- How far do they scroll?
- Which elements are ignored?
-
Session Recordings:
- Where do difficulties arise?
- Which elements cause frustration?
- Why do users leave?
-
Surveys:
- Why didn't they buy?
- What was missing?
- What prevented purchase?
Homepage Optimization
The homepage is the first impression and entry point for most users.

Key Elements to Optimize:
1. Value Proposition (Hero Section)
- Clear answer to "Why buy here?"
- Unique selling proposition in 3 seconds
- Example: "Free shipping on orders over $50"
2. Navigation
- Maximum 7±2 menu items
- Logical category structure
- Mega-menu for large catalogs
3. Search
- Visible, large search bar
- Autocomplete with product photos
- Search by SKU, name, description
4. Trust Signals
- Payment system logos
- Reviews and ratings
- Guarantees and returns
- Contact and support
Common Problems:
| Problem | Impact | Solution |
|---|---|---|
| Unclear value proposition | -15-25% conversion | Clear headline + subheadline |
| Slow loading | -7% per second | Image optimization, CDN |
| No search | -20% conversion | Prominent search bar |
Catalog and Filter Optimization
The catalog is where users search for the right product. Baymard Institute confirms: poor filter UX causes loss of 42% of potential buyers (Baymard Institute, 2024).

Key Filtering Principles:
1. Faceted Navigation
- Filters relevant to category
- Show product count in filter
- Allow multiple selection
2. Sorting
- By popularity (default)
- By price (ascending/descending)
- By newness
- By rating
3. Product Display
- Grid vs List toggle
- 12-24-48 products per page
- Lazy loading or infinite scroll
Pagination Comparison:
| Type | Pros | Cons | Best For |
|---|---|---|---|
| Pagination | SEO-friendly, control | Slow navigation | Large catalogs |
| Load More | UX and SEO balance | Position loss | Medium catalogs |
| Infinite Scroll | Fast UX | Poor for SEO | Social feeds |
Catalog Optimization Checklist:
- Filters visible without scrolling
- Active filters clearly shown
- One-click reset all filters
- Fast loading on filter changes
- Mobile version with bottom sheet for filters
Product Page Optimization
The product page is the key decision point. Detailed guide in a separate article: Product Page Optimization.
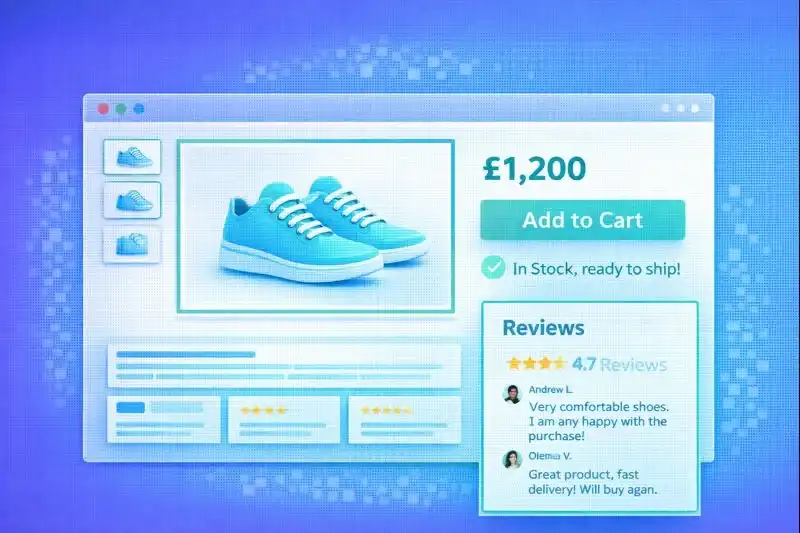
Critical Elements:
| Element | Conversion Impact | Priority |
|---|---|---|
| Product Photos | +30-40% | Critical |
| Price & CTA | +20-30% | Critical |
| Reviews | +15-25% | High |
| Description | +10-15% | High |
| Shipping | +10-20% | High |
Quick Wins for Product Page:
- 5-8 photos from different angles + zoom
- Price above the fold without scrolling
- CTA button in contrasting color
- Reviews with customer photos
- Delivery timeframes near price
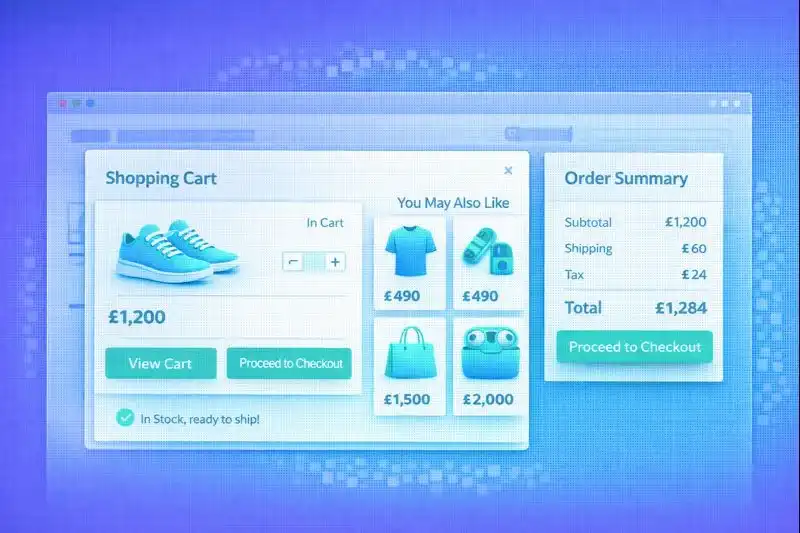
Cart Optimization
The cart is the last step before checkout. Here the user can still change their mind.
Cart Types:
| Type | Description | Best For |
|---|---|---|
| Mini-cart | Dropdown on add | Fast UX |
| Slide-out cart | Side panel | Middle ground |
| Separate page | Full overview | Complex orders |
Effective Cart Elements:
-
Price Transparency
- Product cost
- Shipping cost (or "Free over $X")
- Summary
-
Cross-sell Block
- "Better together"
- "Frequently bought together"
- Maximum 3-4 products
-
Cart Saving
- Auto-save for logged-in users
- Cookie-based for guests
- Email reminders for abandoned carts
-
Progress to Free Shipping
- "Add $15 more for free shipping"
- Visual progress bar
Common Mistakes:
- Hiding shipping cost until checkout
- No "Continue Shopping" button
- Cannot change quantity without page reload
Checkout Optimization
Checkout is the final barrier. Detailed guide: Checkout Optimization.
Key Principles:
- Guest Checkout — mandatory
- Minimum Fields — 8-10 maximum
- Transparent Pricing — shipping visible immediately
- Multiple Payment Methods — cards, Apple Pay, cash on delivery
- Trust Signals — SSL, payment system logos
Checkout Optimization Impact:
| Change | Typical Result |
|---|---|
| Add guest checkout | +25-35% completion |
| Reduce fields from 15 to 8 | +15-20% completion |
| Add Apple Pay | +10-15% mobile conversion |
| Show shipping earlier | -20-30% cart abandonment |
Measurement and Iterations
CRO is a continuous process. ConversionXL confirms: top e-commerce teams run 10-20 tests per month (ConversionXL, 2024).
KPIs for CRO Dashboard:
| Metric | Formula | Benchmark |
|---|---|---|
| Conversion Rate | Purchases / Sessions | 2-3% |
| Add-to-Cart Rate | ATC / Product Views | 8-12% |
| Cart Abandonment | (Carts - Purchases) / Carts | 65-75% |
| Checkout Completion | Purchases / Checkout Starts | 40-50% |
| AOV | Revenue / Orders | Depends on niche |
| Revenue per Visitor | Revenue / Sessions | AOV × CR |
CRO Optimization Cycle:
1. ANALYZE → Collect data, find problems
       ↓
2. HYPOTHESIZE → Formulate solution
       ↓
3. TEST → A/B testing
       ↓
4. ANALYZE → Evaluate results
       ↓
5. IMPLEMENT → Scale
       ↓
   (Repeat cycle)
Test Prioritization (ICE Score):
- Impact: What's the potential impact? (1-10)
- Confidence: How confident are you in the hypothesis? (1-10)
- Effort: How much effort is needed? (1-10, where 10 = easy)
ICE Score = (I + C + E) / 3
Frequently Asked Questions
What is a normal conversion rate for an online store?
Average e-commerce conversion is 2-3%. However, the rate varies significantly by niche: fashion — 1.5-2.5%, electronics — 2-3%, home goods — 3-4%, B2B — 1-2%. It's more important to compare yourself with your own historical metrics and focus on continuous improvement. Top stores achieve 5-10% conversion through systematic CRO work.
How long does CRO optimization take?
CRO is a continuous process, not a one-time project. First results can be seen in 1-3 months of active work. Full CRO culture implementation takes 6-12 months. We recommend starting with quick wins: CTA optimization, adding trust signals, simplifying checkout — this delivers results in weeks.
Where to start CRO with limited budget?
Free tools: Google Analytics 4, Microsoft Clarity (free heatmaps), Hotjar (free plan). First steps: 1) Set up funnel tracking in GA4, 2) Install Clarity for heatmaps, 3) Analyze pages with highest bounce rate, 4) Optimize checkout (guest checkout, fewer fields). This requires no budget, only time.
How to measure ROI from CRO?
Formula: CRO ROI = (Additional Revenue - CRO Costs) / CRO Costs × 100%. Example: Conversion grew from 2% to 2.5% with 100,000 visitors and $100 AOV. Additional revenue = 0.5% × 100,000 × $100 = $50,000/month. With CRO costs of $5,000/month, ROI = ($50,000 - $5,000) / $5,000 = 900%. Typical ROI from CRO programs is 200-500%.
CRO vs SEO vs PPC — what's the priority?
Depends on business stage. If you have traffic but low conversion — prioritize CRO. If you have no traffic — SEO/PPC. Optimal strategy: basic CRO optimization first (1-2 months), then traffic scaling. CRO investment increases efficiency of all acquisition channels: every visitor from SEO or PPC converts better.
Related Articles
- Product Page Optimization — Detailed guide to product card optimization
- Checkout Optimization — How to reduce cart abandonment
- A/B Testing in E-commerce — How to make data-driven decisions
Conclusion
CRO is the most effective growth path for e-commerce in 2025. It drives stable revenue growth, reduces customer acquisition costs, and creates competitive advantage.
Key CRO Principles:
- Data before decisions — analyze, don't guess
- Funnel as a system — optimize every stage
- Quick wins first — fast results motivate
- Always test — validate hypotheses with A/B tests
- Iterate constantly — CRO never ends
Success formula: Analyze → Hypothesize → Test → Implement → Repeat.
Teams that systematically implement CRO win not through budget, but through user understanding.
LetsCommerce provides all CRO tools — from analytics to A/B testing, from optimized checkout to payment system integrations.