Introduction
The product page is the critical decision point in e-commerce. 78% of users leave a site if the product card doesn't clearly answer the question "should I buy this?" (Baymard Institute, 2024).
Research from Nielsen Norman Group shows: a poorly structured description causes loss of up to 40% of potential sales (Nielsen Norman Group, 2024).
This is critical for any market: mobile traffic share in e-commerce exceeds 67%, and page speed and clarity directly impact user trust (Google, 2024).
In 2025, the product card is not just a description — it's a sales tool that combines UX, psychology, SEO, and technology.
Anatomy of the Perfect Product Page
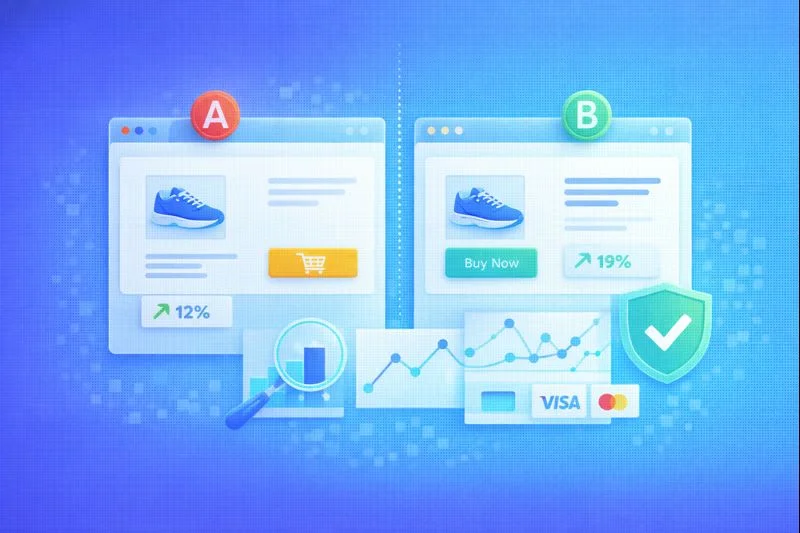
An effective product page has a clear hierarchy. Baymard Institute confirms: proper element placement drives 27% conversion growth.
Essential Product Page Blocks:
- Title + short value proposition — first thing the user sees
- Photo and video gallery — visual quality confirmation
- Price, discount, benefit — clear financial proposition
- CTA button above the fold — no scrolling required
- Key benefits in bullet format — quick scanning
- Reviews and ratings — social proof
- Shipping, payment, returns — objection handling
- Cross-sell and upsell — average order value increase
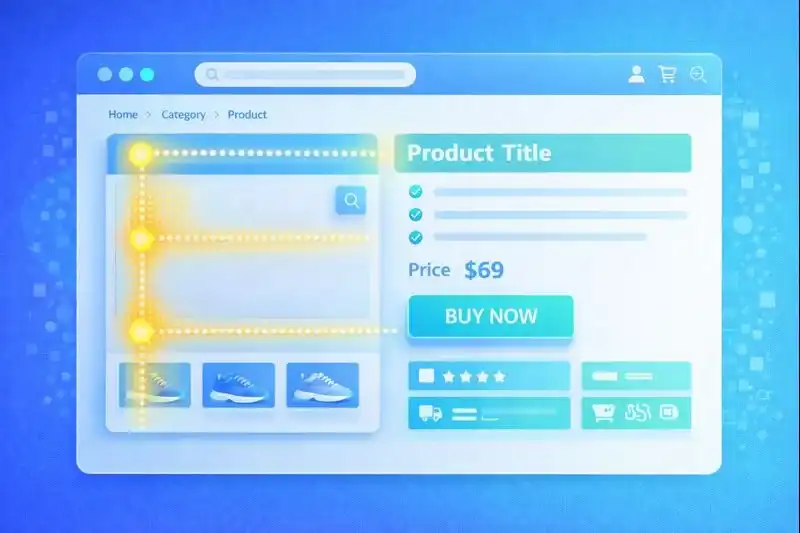
The F-Pattern Principle
Users scan pages in an F-pattern, so the most valuable information should be placed on the left and at the top. Eye-tracking studies show: 80% of attention falls on the left side of the screen and the first 2-3 lines of content.
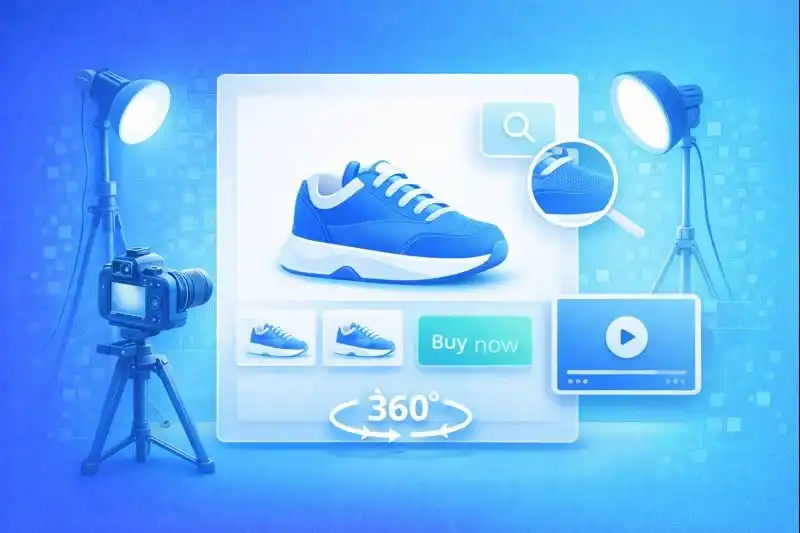
Product Photos and Videos
Visual content drives purchase decisions faster than text. Shopify reports: quality photos drive 33% conversion growth (Shopify, 2024).
Number of Photos
Optimal quantity — 5-8 images per product. Fewer — insufficient information, more — overload.
Required Angles:
- Main photo (front view)
- Back and side views
- Close-up details and texture
- Product in use (lifestyle)
- Size comparison (scale)
Image Functionality
- Zoom — magnification on hover (minimum 2x)
- 360° view — for electronics, footwear, furniture
- Video — usage demonstration (15-60 seconds)
Technical Requirements
- Resolution: minimum 1000x1000 px
- Format: WebP (with JPEG fallback)
- File size: up to 200 KB for fast loading
- White or neutral background for main photos
Product Title and Description
Text content works for SEO and persuasion. 87% of buyers read the description before adding to cart (Salsify, 2024).
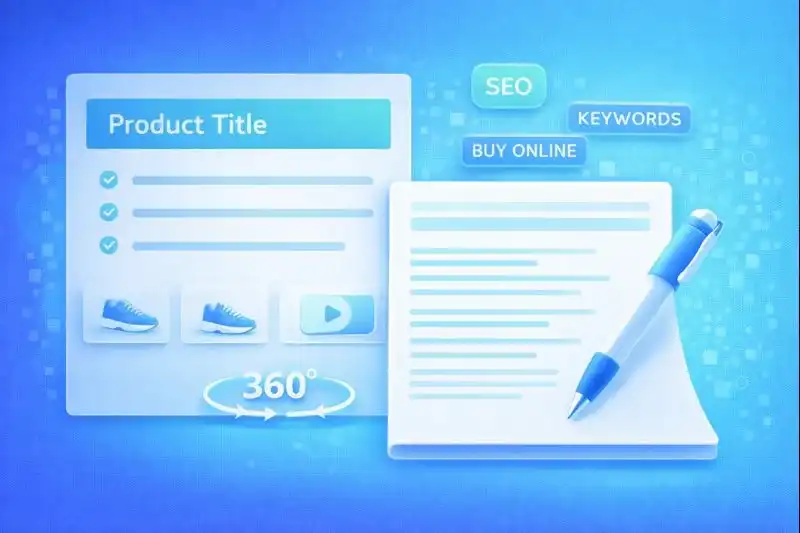
Title Structure
Formula: [Brand] + [Product Type] + [Key Feature] + [Model/Color]
Example: "Samsung Galaxy S24 Ultra 256GB Titanium Black"
Short Description (above the fold)
- 2-3 sentences with main benefits
- Bullet point format
- Answers the question "Why this product?"
Full Description
- 300-1000 words depending on product complexity
- Structure with H3-H4 subheadings
- Technical specifications in a table
- Usage scenarios
- Answers to common questions
SEO Optimization
- Keyword in H1 title
- LSI keywords in description
- Alt tags for all images
- Schema.org Product microdata
Price and CTA Buttons
Price and call-to-action are critical conversion elements. Improper CTA placement reduces conversion by 25-40% (VWO, 2024).

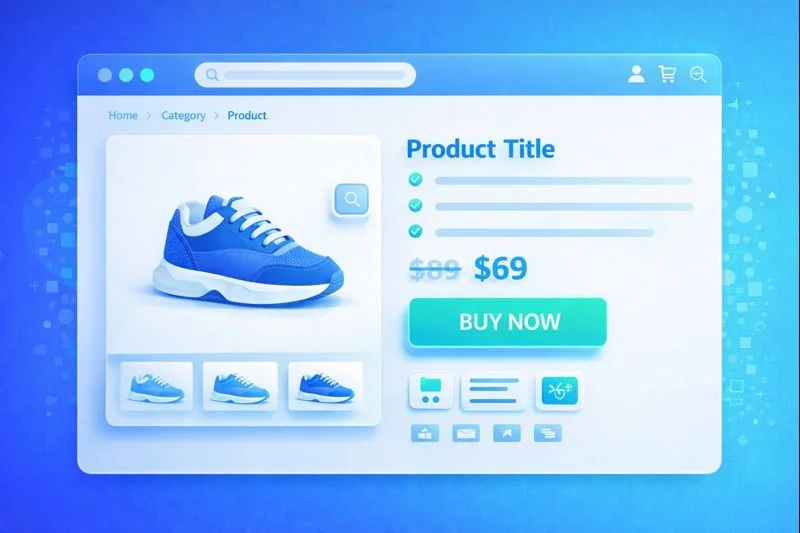
Price Display
- Font size for price — largest on the page (after title)
- Old price crossed out, new price in bright color
- Show savings in percentage and currency: "Save 30% ($120)"
- Price per unit for products with variants
Pricing Psychology
- Charm pricing: $9.99 instead of $10.00
- Anchor effect: show the more expensive option first
- Urgency: "Price valid until [date]" or "Only 3 left"
CTA Button
- Placement: above the fold (no scrolling)
- Color: contrasting to background (green, orange)
- Text: verb + result ("Buy Now", "Add to Cart")
- Size: minimum 44x44 px for mobile
Additional CTAs
- "Buy in 1 Click"
- "Add to Wishlist"
- "Notify When Available"
Social Proof
Reviews and ratings are the most powerful trust tool. 93% of buyers read reviews before purchasing, and products with reviews have 270% higher conversion (Spiegel Research Center, 2024).
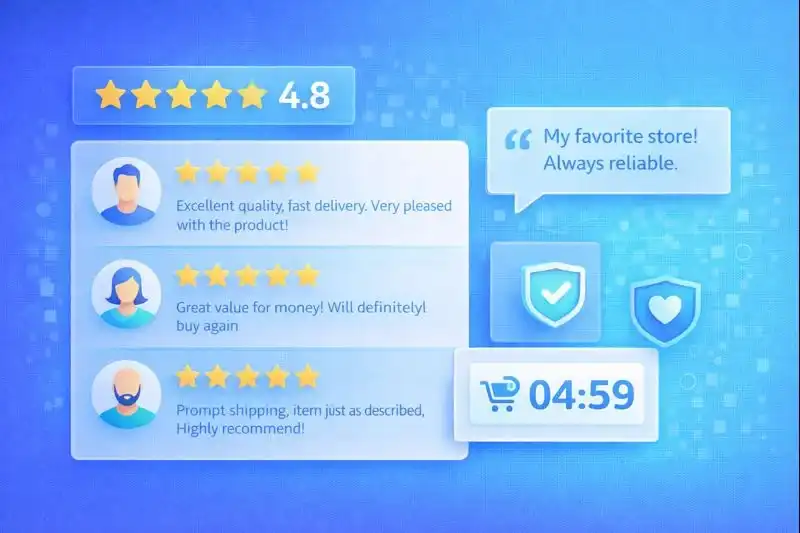
Rating
- Star rating (1-5) near the title
- Number of reviews in parentheses: "★★★★☆ (127 reviews)"
- Microdata for Google display
Customer Reviews
- Verified purchases — confirmation badge
- Filtering capability (by rating, date)
- Customer photos (UGC)
- Store responses to negative reviews
Other Social Proof
- "Purchased 500+ times"
- "12 people viewing now"
- Badges: "Bestseller", "Customer's Choice"
- Certification and award logos
Handling Negative Reviews
Don't delete negative reviews — products with 4.2-4.7 ratings sell better than those with perfect 5.0 (looks more natural).
Technical Optimization
Loading speed directly impacts sales. Every second of delay reduces conversion by 7% (Google, 2024).
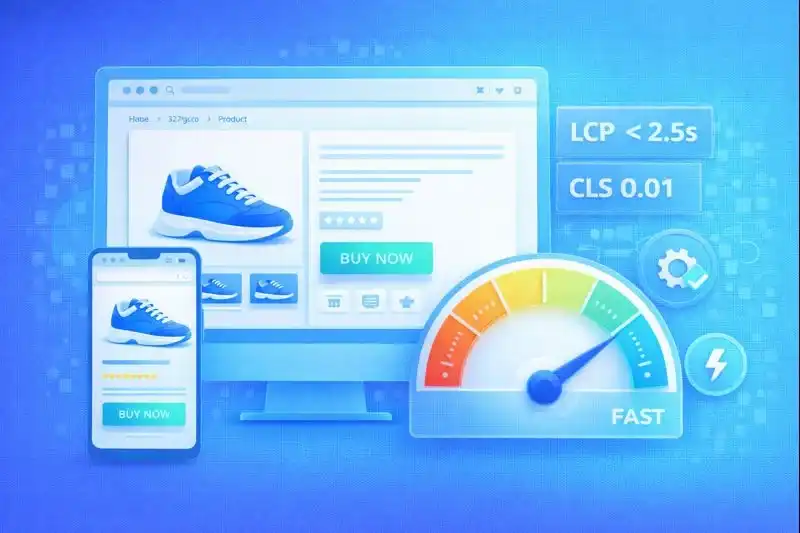
Core Web Vitals for Product Pages
| Metric | Target | What It Measures |
|---|---|---|
| LCP | < 2.5 sec | Main content loading |
| FID | < 100 ms | Time to interactivity |
| CLS | < 0.1 | Visual stability |
Image Optimization
- Lazy loading for photos below the fold
- WebP format with JPEG fallback
- Responsive images (srcset)
- CDN for fast delivery
Mobile Optimization
- 67% of e-commerce traffic is mobile
- Touch-friendly elements (minimum 44px)
- Vertical gallery with swipe
- Sticky CTA button at bottom
- Simplified checkout form
Caching and CDN
- Browser caching for static resources
- CDN for global delivery
- Prefetch for next pages
Cross-sell and Upsell Blocks
Additional sales increase average order value by 10-30%. Amazon generates 35% of revenue through recommendations (McKinsey, 2024).
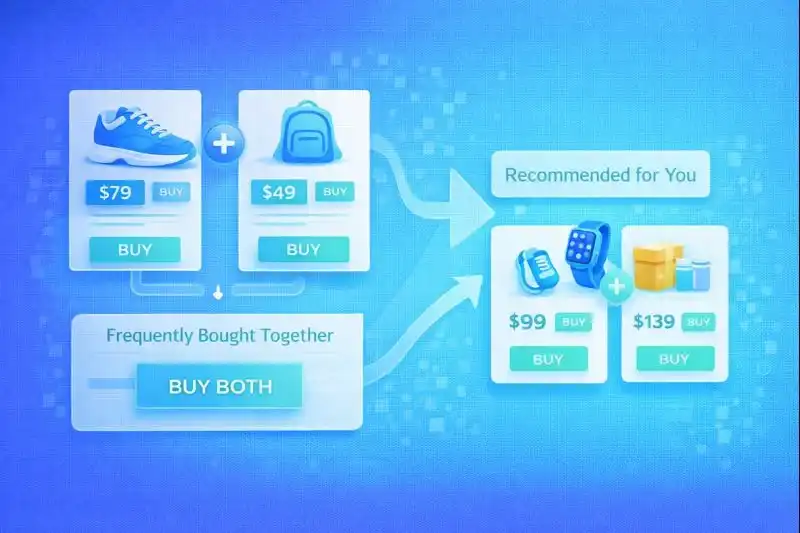
Cross-sell: Related Products
"Frequently Bought Together" or "Complete Your Purchase" block:
- Phone case for phone
- Batteries for toy
- Care product for shoes
Upsell: Upgraded Versions
"Consider Also" or "Premium Option" block:
- Larger storage capacity
- Extended warranty
- Bundle instead of single item
Bundles: Product Sets
- "Better Together" — bundle discount
- Savings visualization
- One click to add entire set
Personalization
- "You Viewed" — browsing history
- "Similar Products" — by characteristics
- AI recommendations based on behavior
Frequently Asked Questions
How many photos should be on a product page?
Optimal quantity is 5-8 images. Shopify research shows that products with 5+ photos have 40% higher conversion compared to products with 1-2 photos. Required angles: front view, back/side view, close-up details, product in use, scale comparison. For complex products (electronics, furniture), add 360° view and video.
What is the optimal product description length?
300-1000 words depending on category. Simple products (clothing, accessories): 300-500 words. Technically complex (electronics, furniture): 700-1000 words. Structure the description: short intro (2-3 sentences), benefit bullets, detailed description, technical specifications in a table. 87% of buyers read descriptions before purchasing, so text quality is critical.
How to properly display a discounted price?
Display three elements: old price (crossed out), new price (in bright color), discount amount (in % and currency). Example: "$299 $199 Save 33% ($100)". Add urgency: "Sale ends January 31" or "Only 5 left at this price". Anchor effect: the old price creates a sense of value.
Is video necessary for every product?
Not for every product, but essential for key categories. Video is critical for: electronics (feature demonstration), clothing/footwear (appearance in motion), furniture (assembly, dimensions), cosmetics (application results). Optimal length: 15-60 seconds. Products with video have 80% higher conversion. For simple products, quality photos are sufficient.
How to collect and display customer reviews?
Active collection: email 7-14 days after delivery asking for a review. Offer a bonus (5-10% discount on next purchase). Display: star rating near title, filtering capability, customer photos, responses to negative reviews. Don't delete negative reviews — products with 4.2-4.7 ratings sell better than perfect 5.0. Mark "Verified Purchase" for trust.
Related Articles
- How to Make Shopping Convenient — UX principles for your entire store
- AR/VR Shopping Experiences: Complete Guide — Interactive product visualization
- Livestream Shopping and Video Commerce — Video content for increased sales
Conclusion
Product page optimization is not a one-time action — it's a continuous improvement process. Every element of the card — from photos to the CTA button — impacts the purchase decision.
Key Principles for 2025:
- Mobile-first — 67%+ traffic from mobile devices
- Visual content — 5-8 photos + video for complex products
- Social proof — reviews increase conversion by 270%
- Speed — every second of delay = -7% conversion
- Cross-sell/Upsell — +10-30% to average order value
Start with an audit of your current product pages using the checklist from this article. Implement changes gradually, measure results with A/B tests, and continue optimizing.
LetsCommerce provides all the tools to create highly effective product pages — from zoom and 360° galleries to integrated reviews and AI recommendations.