Introduction
In 2025, intuitive decisions in e-commerce lead to wasted budget, lost traffic, and competitive disadvantage. According to VWO, 77% of companies that systematically use A/B testing report stable conversion growth (VWO, 2024).
Optimizely confirms: data-driven teams achieve 2x higher ROI from optimization compared to those who rely on assumptions (Optimizely, 2024).
For e-commerce businesses where traffic costs are rising and competition is intensifying, A/B testing is the key tool for scaling without proportionally increasing expenses.
What is A/B Testing in E-commerce
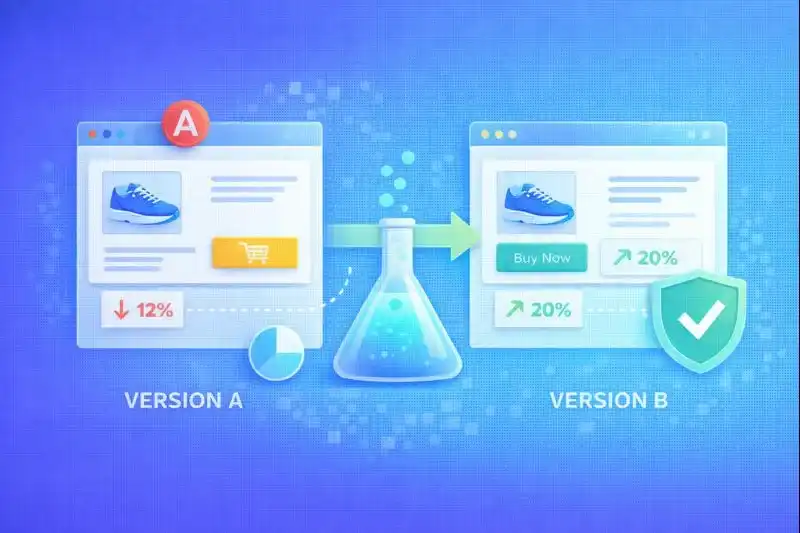
A/B testing is a method of comparing two or more versions of a page or element to determine which performs better based on real data.
Basic concepts:
| Term | Definition |
|---|---|
| Variant A | Control version (current state) |
| Variant B | Test variation (new hypothesis) |
| Metric | Conversion, AOV, CTR, bounce rate |
| Statistical significance | Confidence level, standard — 95% |
| p-value | Probability of random result |
How it works:
- Traffic is split between variants (50/50 or other ratio)
- Users see different versions
- System collects behavioral data
- After reaching statistical significance, winner is determined
A/B testing carries no risk since the test runs on a portion of traffic and is based on real user behavior.
What to Test in Your Online Store
ConversionXL notes: 82% of successful tests focus on small but critical interface elements (ConversionXL, 2024).

Most effective testing objects:
| Element | Test Example | Potential |
|---|---|---|
| CTA buttons | "Buy" vs "Order Now" | +5-15% |
| Headlines | Benefit-focused vs Feature-focused | +3-10% |
| Product photos | White background vs Lifestyle | +10-20% |
| Prices | $9.99 vs $10.00 | +2-5% |
| Checkout | One-page vs Multi-step | +5-15% |
| Colors | Green button vs Orange | +2-8% |
| Social proof | With reviews vs Without | +10-25% |
Real examples:
- CTA: "Buy" vs "Get it today" drives conversion difference up to +14%
- Photos: lifestyle photos drive +18% conversion growth vs white background
- Urgency: countdown timer adds +9% to conversion
How to Formulate Hypotheses Correctly
A strong hypothesis is the foundation of a successful test. Without a clear hypothesis, testing becomes guesswork.
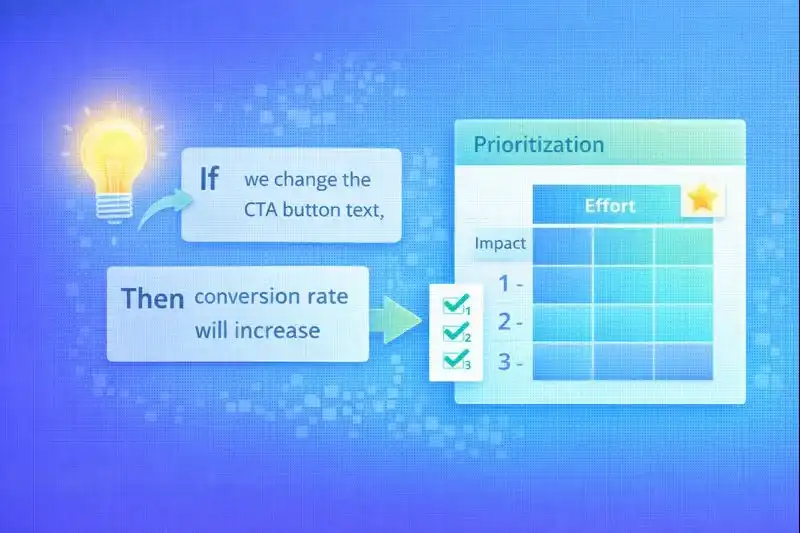
Hypothesis structure:
If we change [X]
Then metric [Y] will increase by [Z%]
Because [reason related to user behavior]
Example of a proper hypothesis:
If we change the CTA text from "Buy" to "Get it today", then conversion will increase by 10%, because the text emphasizes benefit and delivery speed.
Prioritization frameworks:
ICE Score:
- Impact — business impact (1-10)
- Confidence — confidence in hypothesis (1-10)
- Effort — implementation effort (1-10, where 10 = easy)
PIE Score:
- Potential — improvement potential
- Importance — page importance
- Ease — ease of implementation
Teams that use prioritization run 40% more successful tests (HubSpot, 2024).
A/B Testing Tools
After Google Optimize shut down in 2023, the market shifted to professional platforms.
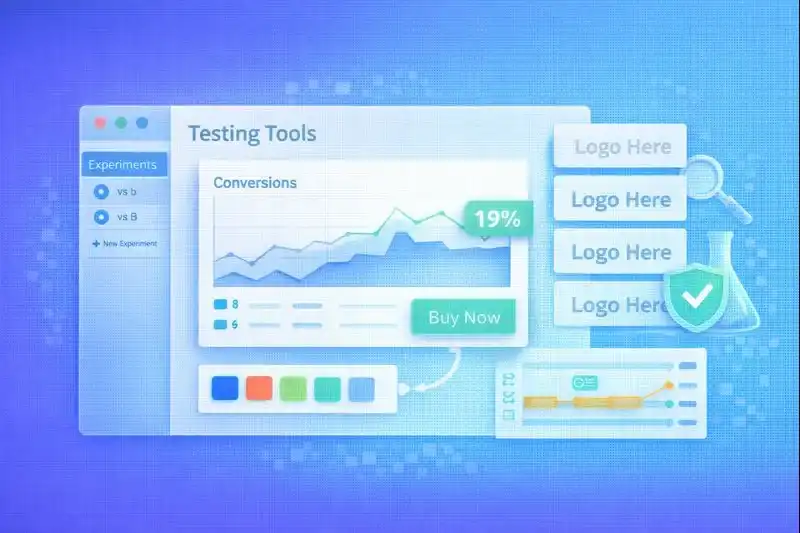
Current tools for 2025:
| Tool | Type | Price | Best for |
|---|---|---|---|
| VWO | Enterprise | from $199/mo | Heatmaps, segmentation |
| Optimizely | Enterprise | from $50k/yr | Feature flags, complex experiments |
| AB Tasty | Mid-market | from $400/mo | UX focus, personalization |
| GrowthBook | Open-source | Free | Startups, technical teams |
| PostHog | Product analytics | from $0 | Product analytics + tests |
Selection criteria:
- Google Analytics 4 integration
- Visual editor (no-code)
- Audience segmentation
- Statistical engine (Bayesian vs Frequentist)
- Mobile device support
For small and medium businesses, ease of setup and cost are important factors.
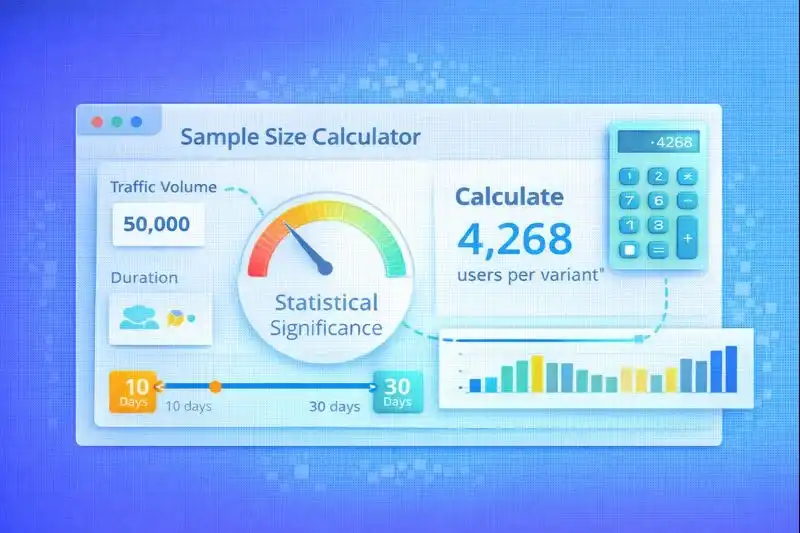
Sample Size and Test Duration Calculation
Insufficient traffic leads to false conclusions. According to Optimizely, 60% of inconclusive tests are related to small sample size (Optimizely, 2024).
Basic guidelines:
| Parameter | Minimum | Optimal |
|---|---|---|
| Statistical significance | 95% | 95-99% |
| Test duration | 7 days | 14-21 days |
| Sessions per variant | 5,000 | 10,000+ |
| Conversions per variant | 100 | 300+ |
Calculation formula:
Required sample size depends on:
- Current conversion rate (baseline)
- Minimum detectable effect (MDE)
- Significance level (usually 95%)
Rules:
- Don't stop tests early — even if you see a winner
- One test — one key KPI — don't scatter focus
- Account for seasonality — test should include weekdays and weekends
- Use calculators — VWO, Optimizely have built-in tools
Common A/B Testing Mistakes
ConversionXL confirms: 48% of tests fail to deliver value due to methodological errors (ConversionXL, 2024).
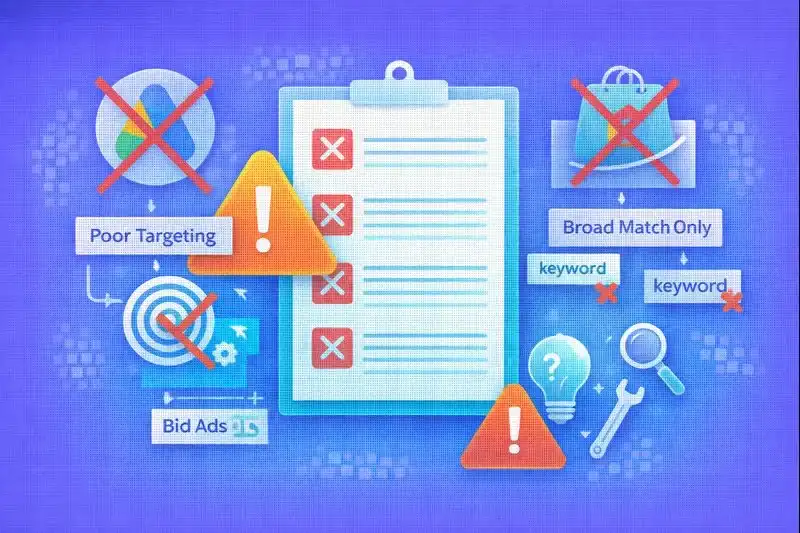
Most common mistakes:
-
Stopping the test too early
- Mistake: saw +20% on day 3 and stopped
- Correct: wait for statistical significance
-
Testing multiple changes at once
- Mistake: changed color, text, and button size
- Correct: one element = one test
-
Ignoring mobile segment
- Mistake: test showed +15%, but mobile was -5%
- Correct: analyze segments separately
-
No hypothesis
- Mistake: "let's try a green button"
- Correct: clear hypothesis with reasoning
-
Focusing only on p-value
- Mistake: p-value < 0.05, so we implement
- Correct: consider business context and absolute effect
Results Analysis and Decision Making
Test results are more than just "winner or not." Deep analysis provides insights for future tests.
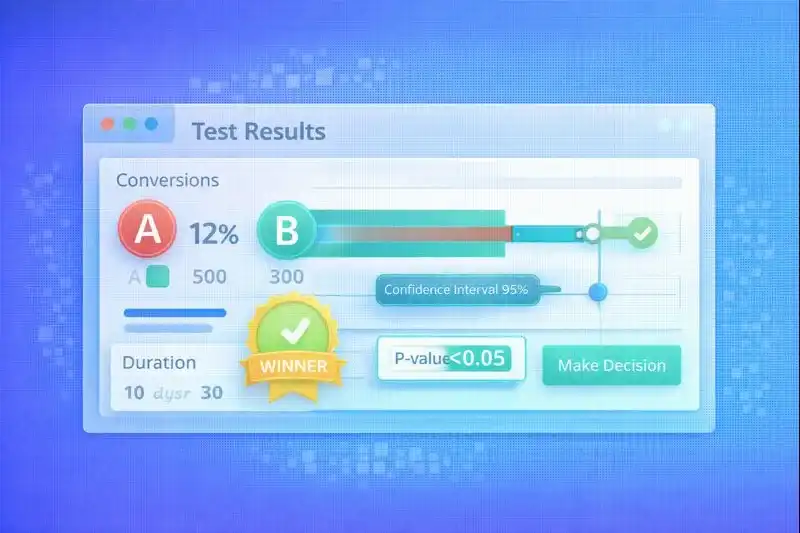
What to analyze:
| Metric | Meaning | Threshold |
|---|---|---|
| p-value | Probability of randomness | < 0.05 |
| Confidence Interval | Effect range | Doesn't cross 0 |
| Lift | Relative increase | > 5% for implementation |
| Revenue impact | Impact on revenue | Positive |
Segments to analyze:
- Desktop vs Mobile
- New vs Returning users
- Traffic sources
- Geography
- Time of day / day of week
What to do with results:
- Winner found: implement, document, launch next test
- No winner: capture insights, adjust hypothesis
- Negative result: important insight — learned what DOESN'T work
Sometimes a test without a winner provides insights for the next iteration — that's also a result.
Building a Culture of Experimentation
Data-driven teams test constantly. Companies with experimentation culture launch 3x more tests per year (VWO, 2024).
Key principles:
-
Document every test
- Hypothesis, result, insights
- Screenshots of variants
- Dates and metrics
-
Single hypothesis backlog
- All ideas in one place
- Prioritization by ICE/PIE
- Owner for each hypothesis
-
Regular result reviews
- Weekly meetings
- Analysis of successes and failures
- Planning next tests
-
Share insights
- Marketing, UX, product — one team
- Share results in Slack/Notion
- Learn from mistakes
Maturity metric: how many tests does the team launch per month?
- 0-1: beginners
- 2-4: developing
- 5+: data-driven culture
Frequently Asked Questions
How much traffic is needed for an A/B test?
5,000–10,000 sessions per variant depending on current conversion and desired MDE (minimum detectable effect). If conversion is 2% and you want to detect a 10% lift, you need ~25,000 sessions per variant. For low-traffic stores, we recommend testing larger changes (higher MDE) or using a Bayesian approach.
How long should an A/B test run?
Minimum 7 days, optimally 14–21 days. The test should cover a complete business cycle: weekdays, weekends, and possible anomalies. Never stop a test early, even if you see an "obvious winner" — it could be statistical noise. Some tools (VWO, Optimizely) automatically determine when a test reaches significance.
Can you test multiple elements simultaneously?
Only in multivariate tests (MVT). For classic A/B — one element per test. MVT allows testing combinations (e.g., button color + text), but requires significantly more traffic. Recommendation: start with A/B, move to MVT when you have 50,000+ sessions per month.
What to do if the test shows no winner?
Document the result, analyze segments, adjust the hypothesis. A "tie" is also a result: you learned that the change doesn't affect the metric. Check: maybe there's an effect in specific segments (mobile, new users). Formulate a new hypothesis and launch the next test. 7 out of 10 tests have no winner — that's normal.
Which metrics to track in e-commerce tests?
Primary metric: purchase conversion. Secondary: AOV (average order value), bounce rate, add-to-cart rate, revenue per visitor. It's important to choose one primary metric before starting the test. Track guardrail metrics — indicators that shouldn't worsen (e.g., traffic quality, time on site).
Related Articles
- Product Page Optimization — Elements to test on product cards
- Checkout Optimization — A/B tests to reduce cart abandonment
- How to Make Shopping Convenient — UX principles for testing
Conclusion
A/B testing is not a one-time activity but a continuous optimization process. Companies that test systematically gain competitive advantage through data-driven decisions.
Key principles for 2025:
- Hypothesis before test — no "let's just try"
- Sufficient sample size — minimum 7-14 days
- One element — one test
- Segment analysis — desktop ≠ mobile
- Documentation — every test = knowledge for the team
Success formula: more tests → more insights → higher conversion.
LetsCommerce supports integration with leading A/B testing platforms and provides analytics for data-driven decision making.

Ready to start selling?
Launch your online store today with LetsCommerce.