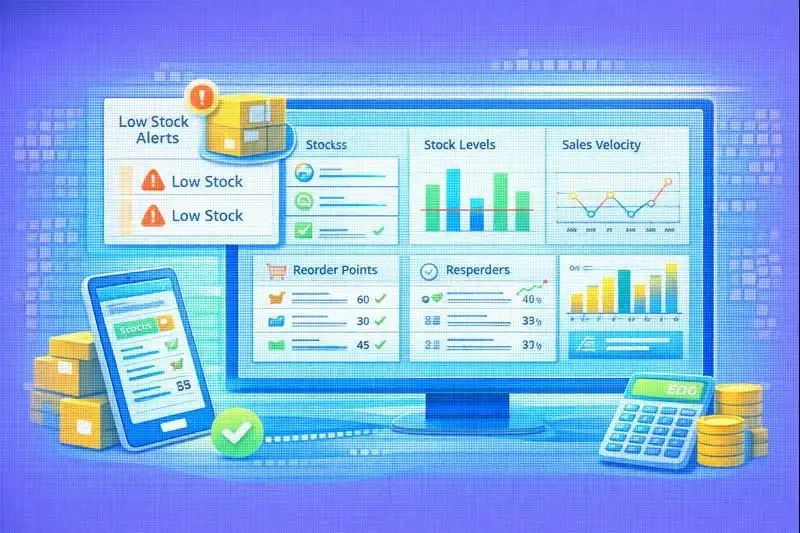
Вступ
Управління запасами – ключовий операційний процес e-commerce, який напряму впливає на cash flow, customer satisfaction, швидкість масштабування бізнесу. Запаси зв'язують оборотний капітал, формують витрати на зберігання, визначають рівень сервісу для клієнтів. Помилки в inventory management швидко трансформуються у stockouts (відсутність товару), втрату продажів, падіння Customer Lifetime Value або у overstocking (надлишок товару), заморожені кошти, необхідність списання неліквідних запасів.
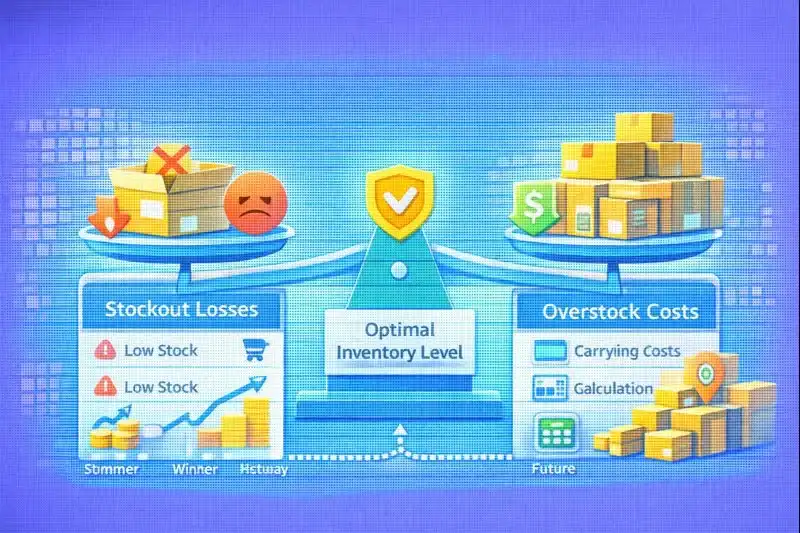
E-commerce бізнес постійно балансує між двома ризиками: відсутність товару в момент попиту або надлишок товару, який не продається. Обидва сценарії мають серйозні фінансові наслідки. За даними досліджень retail-індустрії, недостатні запаси спричиняють втрату 8-12% річного revenue, а надлишкові запаси заморожують 20-30% оборотного капіталу.
Грамотно вибудувана система управління запасами забезпечує прогнозованість операцій, зниження operational costs, стабільний рівень сервісу, здатність швидко реагувати на зміни попиту. ROI інвестицій в inventory management зростає разом з обсягами продажів – що більший бізнес, то критичніша роль оптимізації запасів.

Фундаментальні концепції управління запасами
Перед зануренням у методи та інструменти важливо розуміти базові концепції, які формують foundation inventory management.
Stock Keeping Unit (SKU)
SKU (Stock Keeping Unit) – унікальна одиниця обліку товару в системі. Кожна комбінація товару, його варіації (розмір, колір, комплектація), упаковки має власний унікальний SKU. Наприклад:
- Футболка синя розмір M – SKU: TSHIRT-BLUE-M
- Футболка синя розмір L – SKU: TSHIRT-BLUE-L
- Футболка червона розмір M – SKU: TSHIRT-RED-M
Якісна SKU-структура спрощує аналітику, прогнозування, автоматизацію. Логічна система кодування SKU дозволяє швидко ідентифікувати товар, його характеристики, належність до категорії.
Best practices для SKU:
- Читабельна структура (не випадкові цифри)
- Унікальність (не повторювати)
- Масштабованість (можливість додавати нові товари)
- Інтеграція з постачальниками (якщо є supplier codes)
Lead Time та його вплив
Lead time – час від моменту розміщення замовлення постачальнику до надходження товару на склад і готовності до продажу. Lead time включає:
- Order processing – обробка замовлення постачальником (1-3 дні)
- Production/picking – виробництво або комплектація (варіюється)
- Transportation – транспортування (залежить від відстані)
- Customs – митне оформлення для імпорту (3-7 днів)
- Receiving and inspection – приймання та перевірка на складі (1-2 дні)
Приклад:
- Локальний постачальник: 5-7 днів
- Європейський постачальник: 14-21 день
- Азійський постачальник: 30-45 днів
Нестабільний lead time ускладнює планування та підвищує потребу в safety stock. Якщо постачальник обіцяє 14 днів, але фактично доставляє за 10-20 днів, вариативність становить ±43%, що вимагає значного буфера запасів.
Тісний зв'язок між lead time та логістикою детально розкритий у матеріалі Доставка та логістика.
Reorder Point – коли замовляти
Reorder point (точка перезамовлення) – рівень запасів, при досягненні якого система автоматично ініціює нове замовлення постачальнику. Коректно розрахований reorder point знижує ризик stockout без створення надлишкових запасів.
Базова формула:
Reorder Point = (Average Daily Sales × Lead Time in Days) + Safety Stock
Приклад:
- Середні продажі: 20 одиниць/день
- Lead time: 10 днів
- Safety stock: 50 одиниць
Reorder Point = (20 × 10) + 50 = 250 одиниць
Коли залишок досягає 250 одиниць, система створює замовлення постачальнику.
Safety Stock – буфер безпеки
Safety stock (страховий запас) – буфер для покриття непередбачуваних коливань попиту або затримок постачання. Safety stock захищає від:
- Несподіваних сплесків попиту (вірусний ефект, згадка у медіа)
- Затримок постачальника (виробничі проблеми, логістичні збої)
- Сезонних коливань
- Promotional effects (акції, розпродажі)
Розмір safety stock – trade-off між service level (ймовірність наявності товару) та carrying costs (витрати на зберігання).
Service level targets:
- 95% – стандарт для більшості товарів
- 98-99% – для A-категорії, high-margin products
- 90% – для C-категорії, low-margin products
Stock Turnover Rate – швидкість обороту
Stock turnover rate (коефіцієнт оборотності) показує, скільки разів запас повністю продається і поповнюється за період.
Формула:
Stock Turnover = Cost of Goods Sold (COGS) / Average Inventory Value
Приклад:
- COGS за рік: ₴2,400,000
- Середній запас: ₴400,000
Stock Turnover = 2,400,000 / 400,000 = 6 разів на рік
Це означає, що в середньому запас оновлюється кожні 2 місяці (12 / 6 = 2).
Benchmarks по індустріях:
- Fashion/Apparel: 4-6 разів
- Electronics: 6-8 разів
- FMCG/Food: 10-15 разів
- Jewelry/Luxury: 2-4 рази
- Books: 3-5 разів
Високий оборот знижує заморожений капітал та carrying costs, але підвищує ризик stockouts. Низький оборот сигналізує про slow-moving inventory, надлишкові запаси або проблеми з продажами.
Carrying Costs vs Stockout Costs
Фундаментальний trade-off inventory management – баланс між carrying costs (витратами на утримання запасів) та stockout costs (витратами від відсутності товару).
Carrying Costs включають:
- Storage costs – оренда складу (₴/м² × площа)
- Insurance – страхування запасів (1-3% від вартості)
- Utilities – електрика, опалення, охолодження
- Labor – персонал складу (приймання, комплектація, інвентаризація)
- Depreciation – амортизація обладнання
- Obsolescence – знецінення (застарівання моделей, сезонність)
- Opportunity cost – втрачена можливість інвестувати кошти інакше
Typical carrying cost: 20-30% річних від середньої вартості запасів
Stockout Costs включають:
- Lost sales – прямий втрачений revenue
- Lost customers – клієнти йдуть до конкурентів
- Brand damage – негативний вплив на репутацію
- LTV impact – зниження довгострокової цінності клієнта
- Emergency orders – термінові дорогі закупівлі
- Production disruptions – для виробників
Stockout cost estimation:
Якщо 100 клієнтів не знайшли товар:
- 30% купують пізніше (delayed sale)
- 50% купують у конкурента (lost sale)
- 20% більше не повертаються (lost customer)
Lost Sale Impact = 50 customers × ₴800 AOV = ₴40,000
Lost Customer Impact = 20 customers × ₴3,000 LTV = ₴60,000
Total Stockout Cost = ₴100,000
ABC Аналіз: Пріоритизація Запасів
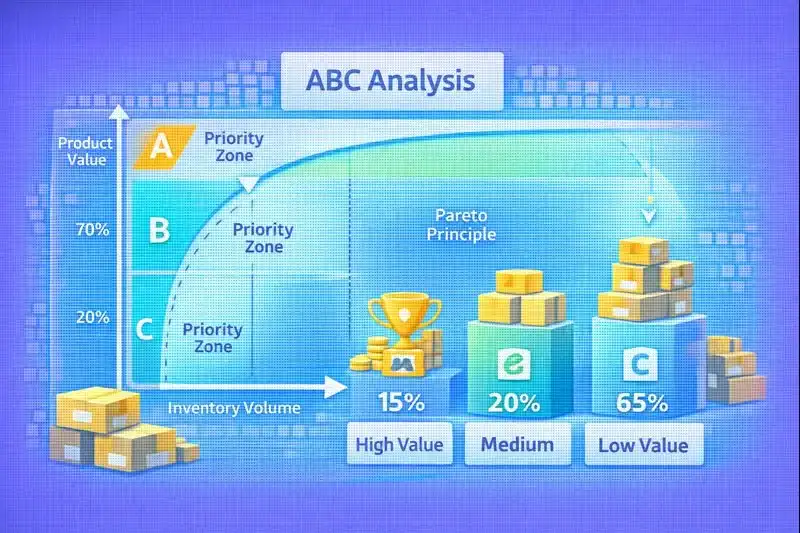
ABC аналіз – фундаментальний інструмент inventory management, заснований на Pareto принципі: невелика частка товарів генерує левову частку обороту.
Концепція ABC класифікації
ABC класифікація розподіляє всі SKU на три категорії за їх вкладом в оборот:
Категорія A (High Value):
- 15-20% всіх SKU
- Генерують 70-80% обороту
- Критичні для бізнесу
- Вимагають найбільшої уваги
Категорія B (Medium Value):
- 25-35% SKU
- Генерують 15-20% обороту
- Помірна важливість
- Стандартне управління
Категорія C (Low Value):
- 45-60% SKU
- Генерують лише 5-10% обороту
- Низький пріоритет
- Мінімальні зусилля
Як проводити ABC аналіз
Крок 1: Зібрати дані про продажі всіх SKU за період (рік, квартал)
Крок 2: Розрахувати revenue contribution кожного SKU
Крок 3: Відсортувати SKU за спаданням revenue
Крок 4: Розрахувати cumulative % від total revenue
Крок 5: Класифікувати:
- Cumulative 0-80%: Category A
- Cumulative 80-95%: Category B
- Cumulative 95-100%: Category C
Практичний приклад ABC аналізу
Припустимо, інтернет-магазин має 10 товарів з річним оборотом ₴2,000,000:
| SKU | Annual Revenue | % від Total | Cumulative % | Category |
|---|---|---|---|---|
| SKU-001 | ₴500,000 | 25% | 25% | A |
| SKU-002 | ₴420,000 | 21% | 46% | A |
| SKU-003 | ₴380,000 | 19% | 65% | A |
| SKU-004 | ₴210,000 | 10.5% | 75.5% | A |
| SKU-005 | ₴160,000 | 8% | 83.5% | B |
| SKU-006 | ₴120,000 | 6% | 89.5% | B |
| SKU-007 | ₴90,000 | 4.5% | 94% | B |
| SKU-008 | ₴60,000 | 3% | 97% | C |
| SKU-009 | ₴40,000 | 2% | 99% | C |
| SKU-010 | ₴20,000 | 1% | 100% | C |
Результат:
- Category A: 4 SKU (40%) генерують ₴1,510,000 (75.5%)
- Category B: 3 SKU (30%) генерують ₴370,000 (18.5%)
- Category C: 3 SKU (30%) генерують ₴120,000 (6%)
Різні стратегії для A, B, C категорій
| Аспект | Category A | Category B | Category C |
|---|---|---|---|
| Monitoring | Щоденний | Щотижневий | Щомісячний |
| Reorder frequency | Висока (2-4 тижні) | Середня (1-2 місяці) | Низька (квартально) |
| Safety stock | Високий (20-30 днів) | Середній (10-15 днів) | Низький (5-7 днів) |
| Supplier relationship | Strategic partnership | Standard terms | Transactional |
| Forecasting method | Advanced (ML) | Statistical | Simple averages |
| Stock location | Prime picking zone | Standard zone | Remote zone |
| Service level target | 98-99% | 95% | 90% |
Приклад застосування:
Category A: SKU-001 (топ продавець)
- Daily monitoring stock levels
- Automated reorder при досягненні reorder point
- Safety stock: 30 днів продажів
- Exclusive договір з постачальником з гарантованими термінами
- ML forecasting враховує seasonality та trends
Category C: SKU-010 (рідкісні продажі)
- Monthly inventory check
- Manual reorder тільки якщо є попит
- Minimal safety stock (5 днів)
- Generic supplier, ніяких спеціальних умов
- Simple average demand forecast
Economic Order Quantity (EOQ) – Оптимальний Розмір Замовлення
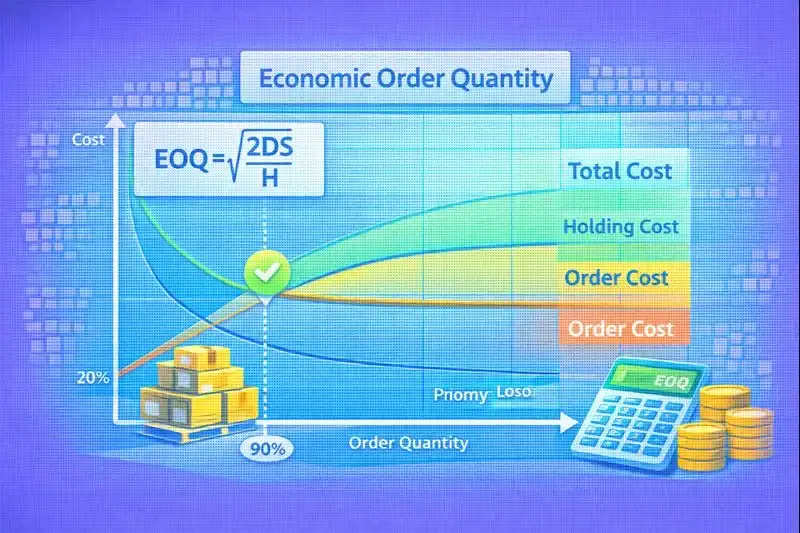
Economic Order Quantity (EOQ) – класична модель inventory management, яка визначає оптимальний розмір замовлення, що мінімізує total inventory costs.
Логіка EOQ моделі
EOQ балансує два типи витрат:
Ordering Costs (витрати на замовлення):
- Адміністративні витрати на оформлення PO
- Комунікація з постачальником
- Приймання та інспекція товару
- Обробка інвойсів та оплата
Чим більше замовлень на рік → тим вищі ordering costs
Holding Costs (витрати на зберігання):
- Storage space (оренда складу)
- Insurance та security
- Амортизація та псування
- Opportunity cost of capital
Чим більше замовлення → тим довше зберігаємо → тим вищі holding costs
EOQ знаходить точку балансу.
Формула EOQ
EOQ = √((2 × Annual Demand × Order Cost) / Holding Cost per Unit per Year)
Компоненти:
- Annual Demand (D) – річний попит в одиницях
- Order Cost (S) – вартість одного замовлення (fixed cost)
- Holding Cost (H) – вартість зберігання однієї одиниці на рік
Детальний практичний приклад
Дано:
- Annual Demand: 12,000 одиниць
- Order Cost: ₴500 за замовлення (admin + shipping + receiving)
- Unit Cost: ₴100 за одиницю
- Holding Cost Rate: 20% річних (₴20 per unit per year)
Розрахунок EOQ:
EOQ = √((2 × 12,000 × 500) / 20)
EOQ = √(12,000,000 / 20)
EOQ = √600,000
EOQ ≈ 775 одиниць
Інтерпретація:
Оптимальний розмір замовлення: 775 одиниць
Кількість замовлень на рік:
Number of Orders = Annual Demand / EOQ
= 12,000 / 775
≈ 15.5 замовлень на рік
Інтервал між замовленнями:
Days Between Orders = 365 / 15.5
≈ 24 дні
Total Inventory Cost при EOQ:
Total Cost = (D/Q × S) + (Q/2 × H)

Ordering Cost = (12,000/775) × 500 = ₴7,742
Holding Cost = (775/2) × 20 = ₴7,750

Total Cost = ₴15,492 per year
Порівняння з неоптимальними розмірами:
| Order Size | Orders/Year | Ordering Cost | Holding Cost | Total Cost |
|---|---|---|---|---|
| 500 (too small) | 24 | ₴12,000 | ₴5,000 | ₴17,000 |
| 775 (EOQ) | 15.5 | ₴7,742 | ₴7,750 | ₴15,492 ✅ |
| 1,500 (too large) | 8 | ₴4,000 | ₴15,000 | ₴19,000 |
EOQ економить ₴1,508-3,508 річних порівняно з неоптимальними розмірами.
Коли EOQ працює добре
EOQ ефективна коли:
- ✅ Стабільний попит (низька варіативність)
- ✅ Постійні costs (ordering та holding не змінюються)
- ✅ Миттєве поповнення (lead time не враховується)
- ✅ Один продукт або незалежні продукти
- ✅ Нема quantity discounts від постачальника
Обмеження EOQ моделі
EOQ НЕ працює добре коли:
- ❌ Високо сезонний попит (fashion, gifts)
- ❌ Quantity discounts (постачальник дає знижки на великі обсяги)
- ❌ Обмеження warehouse space
- ❌ Perishable products (food, cosmetics з терміном придатності)
- ❌ Just-in-Time strategy
- ❌ Нестабільний lead time
Альтернативи EOQ
1. EOQ with Quantity Discounts:
Модифікація EOQ враховує price breaks. Розраховуємо total cost для кожного price tier і обираємо мінімальний.
2. Just-in-Time (JIT):
Мінімальні запаси, частіші поставки, тісна інтеграція з постачальником. Потребує надійних постачальників та стабільного demand.
3. Dynamic Reorder:
Використовує real-time demand signals та ML forecasting замість fixed EOQ.
Методи Управління Запасами
Різні бізнес-моделі та продуктові категорії вимагають різних підходів до inventory management.
Порівняльна таблиця методів
| Метод | Суть | Переваги | Недоліки | Best For |
|---|---|---|---|---|
| Just-in-Time (JIT) | Мінімальні запаси, поставки точно в момент потреби | Низькі carrying costs, fresh stock | Високий ризик stockout, залежність від постачальника | High-volume, reliable suppliers |
| FIFO | First-In-First-Out, старіші запаси продаються першими | Контроль якості, зниження obsolescence | Потребує disciplined warehouse layout | Perishables, dated products |
| LIFO | Last-In-First-Out, нові запаси продаються першими | Простота logistics | Ризик списань старих запасів | Non-perishables, stable products |
| Dropshipping | Товар напряму від постачальника клієнту | Нульові inventory costs, низький ризик | Низька маржа, немає контролю якості | Testing products, wide assortment |
| Consignment | Запаси на вашому складі належать постачальнику | Низький financial risk | Обмежений вибір постачальників | High-value products, new partnerships |
| VMI | Vendor-Managed Inventory, постачальник керує вашими запасами | Оптимізація supply chain, автоматизація | Втрата контролю, потребує integration | Strategic partnerships, high volume |
Just-in-Time (JIT) детально
Концепція: Отримувати товар точно коли потрібно, не тримаючи warehouse stock.
Приклад успіху: Dell Computers – збирають комп'ютери на замовлення з компонентів, що надходять JIT.
Вимоги для JIT:
- Надійні постачальники з short lead times
- Excellent forecasting
- Robust communication systems
- Backup plans на випадок disruptions
Ризики:
- Supply chain disruptions (COVID-19 показав вразливість JIT)
- Lost sales від stockouts
- Вища залежність від постачальників
FIFO vs LIFO
FIFO (First-In-First-Out):
Товари, що надійшли першими, продаються першими.
Коли критично:
- Продукти харчування (expiry dates)
- Косметика та фарма (shelf life)
- Electronics (obsolescence)
- Fashion (сезонність)
Warehouse implementation: Фізична організація складу змушує брати старіші запаси першими (flow-through racking, gravity systems).
LIFO (Last-In-First-Out):
Новіші товари продаються першими.
Переваги: Простота logistics – беремо те що зверху.
Ризики: Старі запаси накопичуються на дні, можуть стати obsolete.
Використання: Non-perishables without expiry concerns (screws, nuts, generic supplies).
Dropshipping vs Owned Inventory
Dropshipping:
Pros:
- Zero inventory investment
- No warehouse needed
- Wide product selection без ризику
- Test products before committing
Cons:
- Low margins (постачальник бере частку)
- No quality control
- Slower shipping
- Limited brand experience control
- Залежність від supplier stock
Owned Inventory:
Pros:
- Higher margins
- Quality control
- Faster shipping (якщо local stock)
- Brand experience control
- Flexibility в pricing та promotions
Cons:
- Capital tied in inventory
- Warehouse costs
- Obsolescence risk
- Complexity management
Decision framework:
Use Dropshipping for:
- Testing new products/niches
- Low-frequency purchases
- High-variety catalogs
- Startups з обмеженим capital
Use Owned Inventory for:
- Best sellers з predictable demand
- High-margin products
- Products requiring quality control
- Building brand з custom packaging
Hybrid approach: Combination – owned inventory для top 20% (category A), dropship решту.
Safety Stock та Reorder Point Розрахунки
Формула Safety Stock
Класична формула враховує варіативність demand та lead time:
Safety Stock = Z-score × √((Avg Lead Time × Variance of Demand) + (Avg Demand² × Variance of Lead Time))
Спрощена версія:
Safety Stock = (Maximum Daily Usage × Maximum Lead Time) - (Average Daily Usage × Average Lead Time)
Детальний приклад Safety Stock
Дано:
- Average Daily Sales: 40 units
- Max Daily Sales: 60 units (під час promotion або spike)
- Average Lead Time: 5 days
- Max Lead Time: 7 days (затримки постачальника)
Розрахунок:
Safety Stock = (60 × 7) - (40 × 5)
             = 420 - 200
             = 220 units
Інтерпретація:
Потрібно тримати додатково 220 одиниць як буфер на випадок:
- Несподіваного зростання продажів до 60/day
- Затримки постачання до 7 днів
Reorder Point Formula
Reorder Point = (Average Daily Sales × Average Lead Time) + Safety Stock
Продовження прикладу:
Reorder Point = (40 × 5) + 220
              = 200 + 220
              = 420 units
Workflow:
- Stock level досягає 420 units
- System автоматично створює PO постачальнику
- За 5 днів (avg lead time) продасться 200 units
- Залишиться 220 units (safety stock)
- Товар від постачальника надходить
- Stock level повертається до normal
Якщо worst case scenario:
- Demand spike до 60/day
- Lead time затримка до 7 days
- Продасться: 60 × 7 = 420 units
- Саме стільки було при reorder (420)
- Safety stock повністю використаний, але stockout уникнуто
Service Level та Z-Score
Service level – ймовірність НЕ мати stockout.
| Service Level | Z-Score | Meaning |
|---|---|---|
| 90% | 1.28 | 10% ймовірність stockout |
| 95% | 1.65 | 5% ймовірність stockout |
| 98% | 2.05 | 2% ймовірність stockout |
| 99% | 2.33 | 1% ймовірність stockout |
Вищий service level = більше safety stock = вищі carrying costs.
Trade-off decision:
Category A products: 98-99% service level (рідкісні stockouts acceptable) Category B products: 95% service level Category C products: 90% service level (stockouts OK, низький impact)
Demand Forecasting для Точного Планування
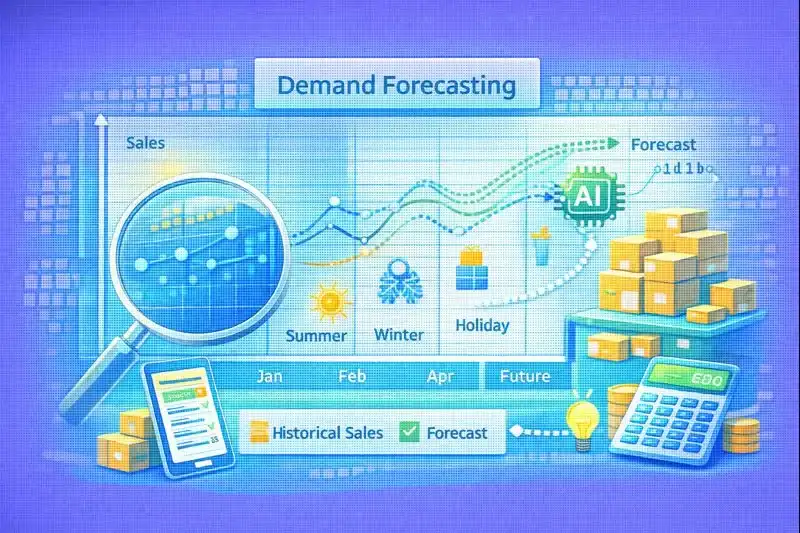
Точне прогнозування попиту – foundation ефективного inventory management. Неточні прогнози призводять до stockouts або overstocking.
Методи прогнозування
1. Historical Averages (Прості середні)
Найпростіший метод – average продажів за минулі періоди.
Forecast = (Sales Period 1 + Sales Period 2 + ... + Sales Period N) / N
Pros: Простота Cons: Не враховує trends та seasonality
2. Moving Averages (Ковзні середні)
Average останніх N періодів, window "рухається" вперед.
3-Month Moving Average = (Month -3 + Month -2 + Month -1) / 3
Приклад:
| Month | Actual Sales | 3-Month MA |
|---|---|---|
| Jan | 100 | - |
| Feb | 120 | - |
| Mar | 110 | - |
| Apr | 130 | (100+120+110)/3 = 110 |
| May | 140 | (120+110+130)/3 = 120 |
| Jun | 135 | (110+130+140)/3 = 127 |
3. Exponential Smoothing
Дає більшу вагу recent data, менша вагу older data.
Forecast(t) = α × Actual(t-1) + (1-α) × Forecast(t-1)
α (alpha) – smoothing constant (0-1)
- α близько до 1: reactive до changes
- α близько до 0: smooth, less reactive
4. Seasonal Decomposition
Виділяє три компоненти:
- Trend – довгостроковий напрямок (зростання/спад)
- Seasonality – повторювані patterns (зима vs літо)
- Residual – випадкові коливання
5. Machine Learning
Advanced techniques: ARIMA, Prophet (by Facebook), LSTM neural networks.
Pros:
- Враховує множину факторів (weather, holidays, campaigns)
- Adapts до complex patterns
- Continuously improves
Cons:
- Потребує significant historical data
- Technical expertise
- Computational resources
Handling Seasonal Products
Challenge: Selling winter coats – demand сконцентрований у 3-4 місяцях.
Strategy:
1. Pre-season build-up:
- Start accumulating stock 2-3 months before season
- Based на previous year demand × growth factor
2. In-season agility:
- Monitor sell-through rate weekly
- Adjust reorders based на actual demand
- Avoid stockouts першої половини season
3. End-of-season liquidation:
- Plan discounts/promotions to clear stock
- Avoid carrying stock до next season (high carrying cost)
4. Post-season analysis:
- Compare forecast vs actual
- Learn для next year
Warehouse Organization та Layout
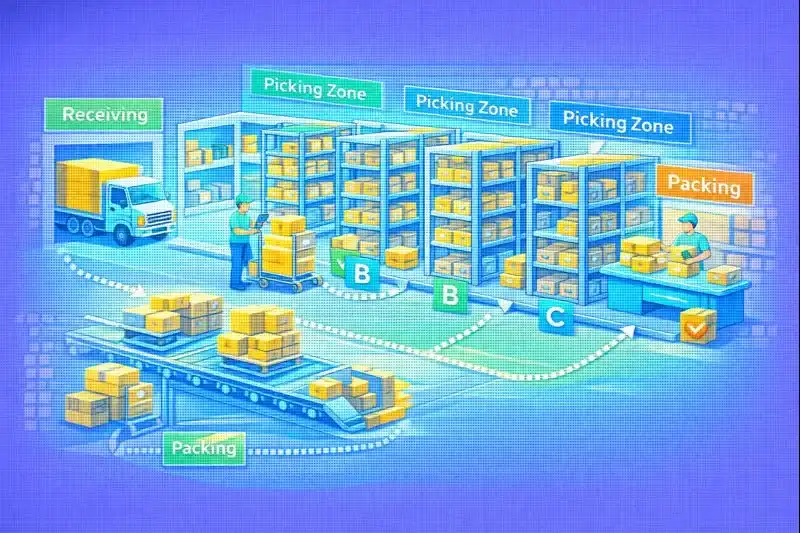
Фізична організація складу dramatically впливає на operational efficiency, picking speed, accuracy.
Warehouse Zones та Functions
| Zone | Function | Optimization Strategy |
|---|---|---|
| Receiving | Приймання товару від постачальників | Dedicated dock doors, QR code scanning, quality inspection |
| Storage | Зберігання inventory | ABC slotting (A-items closest to picking), vertical space utilization |
| Picking | Комплектація замовлень | Optimize pick paths, batch picking, zone picking |
| Packing | Пакування для відправки | Standardized packaging materials, print-and-apply labels |
| Shipping | Відправка клієнтам | Carrier integration, pickup scheduling, staging area |
ABC Slotting Optimization
Principle: Розмістити швидкообігові товари (Category A) найближче до packing zone, щоб мінімізувати travel time.
Warehouse heat map:
[Receiving] ← далеко → [Category C Storage] → [Category B Storage] → [Category A Storage] → [Picking/Packing] → [Shipping]
Metrics:
Якщо A-items (20% SKU) генерують 80% picks, розміщення їх близько економить:
- 80% picking trips are short
- Only 20% trips are long (для B/C items)
Impact: Reduction у picking time на 30-50%, що означає:
- Більше orders processed per day
- Lower labor costs
- Faster fulfillment
FIFO Enforcement через Layout
Для products з expiry dates, warehouse layout має фізично enforc FIFO:
Flow-through racking:
- Товар входить з одного боку
- Виходить з іншого боку
- Gravity або conveyor рухає старіші items вперед
Alternative: Date-based labeling з strict picking rules.
Cross-Docking для Швидкообігових Товарів
Cross-docking – товар з incoming truck відразу йде на outgoing truck, bypassing storage.
Use cases:
- Pre-sold inventory (already has customer orders)
- High-velocity items (A-category)
- Time-sensitive products (fresh food)
Benefits:
- Faster fulfillment (same-day shipping)
- Lower handling costs
- Reduced storage space needs
Inventory Management Software та Automation
Ефективне inventory management неможливе без technology. Software автоматизує routine tasks, забезпечує visibility, enable data-driven decisions.
Типи Inventory Management систем
1. Standalone Inventory Software
Dedicated inventory management платформа.
Pros:
- Specialized features
- Best-in-class inventory capabilities
- Affordable
Cons:
- Потребує integration з e-commerce та accounting
- Може бути data sync issues
Examples: TradeGecko (now QuickBooks Commerce), Cin7, Ordoro
2. ERP-Integrated Systems
Inventory module як частина Enterprise Resource Planning системи.
Pros:
- Single source of truth
- Seamless integration (inventory, accounting, CRM, HR)
- Enterprise-grade
Cons:
- Expensive
- Complex implementation
- Overkill для малого бізнесу
Examples: SAP, Oracle NetSuite, Microsoft Dynamics
3. E-commerce Native Inventory
Inventory management вбудований у e-commerce платформу.
Pros:
- Out-of-box integration
- Simple setup
- Affordable (included у platform)
Cons:
- Limited advanced features
- Single-channel focus (якщо продаєте multi-channel)
Examples: Shopify inventory, WooCommerce stock management, LetsCommerce inventory module
Key Features для Inventory Software
Must-have features:
- Real-time stock tracking – accurate stock levels across locations
- Automated reorder points – система створює PO автоматично
- Multi-location support – manage inventory across warehouses
- Barcode/SKU scanning – для accurate receiving та picking
- Forecasting tools – demand prediction
- Reporting & analytics – turnover, sell-through, ABC analysis
- Integration capabilities – e-commerce, accounting, shipping
- Mobile app – warehouse staff can update on-the-go
Nice-to-have features:
- Batch and serial number tracking
- Kitting and bundling (створення product bundles)
- Cycle counting tools
- Vendor management
- Return merchandise authorization (RMA)
Integration з E-commerce Платформами
Seamless integration між inventory system та e-commerce store критична для:
1. Real-time stock synchronization
- Customer sees accurate availability
- Prevents overselling
- Automatic updates коли order placed
2. Automated order flow
- New order → picks up inventory details
- Generates pick list
- Updates stock після fulfillment
3. Multi-channel inventory allocation
- Selling на website + marketplace + retail
- Central inventory pool
- Smart allocation algorithms
Детальніше про integration approaches у статті Автоматизація маркетингу.
Barcode та RFID Technology
Barcode Systems:
Workflow:
- Receiving: Scan barcode → verify quantity → update system
- Putaway: Scan location → scan product → confirm placement
- Picking: Scan order → scan items → verify accuracy
- Shipping: Final scan → update stock → create tracking
Benefits:
- 99.9% accuracy (vs 80-90% manual)
- Faster processing
- Real-time updates
- Audit trail
RFID (Radio-Frequency Identification):
RFID tags can be scanned без direct line of sight, multiple items simultaneously.
Use cases:
- High-value items (jewelry, electronics)
- Anti-theft
- Automated checkout
- Real-time location tracking
Limitation: Higher cost per tag (₴5-50 vs ₴0.1 для barcode).
Mobile Inventory Management
Mobile apps дозволяють warehouse staff:
- Update stock levels on-the-go
- Perform cycle counts with mobile scanner
- Receive alerts про low stock
- Process returns on spot
ROI: Зменшення часу на inventory tasks на 40-60%.
Метрики та KPI для Відстеження
Ефективність inventory management вимірюється через ключові KPI. Регулярний моніторинг цих метрик дозволяє виявляти problems і optimizing operations.
Inventory Turnover Ratio
Формула:
Inventory Turnover = Cost of Goods Sold (COGS) / Average Inventory Value
Приклад:
- COGS: ₴3,000,000
- Average Inventory: ₴500,000
Turnover = 3,000,000 / 500,000 = 6 times per year
Interpretation: Запас повністю обертається 6 разів на рік (кожні 2 місяці).
Benchmarks:
- Fashion: 4-6
- Electronics: 6-8
- Grocery: 10-15
- Luxury: 2-4
Що означає:
- High turnover (>10): Efficient, but ризик stockouts
- Low turnover (<2): Slow-moving inventory, tied capital
Days Sales of Inventory (DSI)
DSI показує скільки днів в середньому inventory sits перед продажем.
Формула:
DSI = (Average Inventory / COGS) × 365
Приклад:
DSI = (₴500,000 / ₴3,000,000) × 365
    = 0.1667 × 365
    = 61 days
Interpretation: В середньому товар зберігається 61 день перед продажем.
Target: <90 days для більшості бізнесів.
Зв'язок з Turnover:
DSI = 365 / Inventory Turnover
Stockout Rate
Формула:
Stockout Rate = (Number of Stockout Incidents / Total Order Opportunities) × 100%
Приклад:
- 50 times товар був unavailable when customer wanted
- 2,500 total orders attempted
Stockout Rate = (50 / 2,500) × 100% = 2%
Target: <2% для category A, <5% overall.
Cost of stockouts:
Якщо stockout rate 2% та:
- Monthly orders: 1,000
- AOV: ₴800
- Lost orders: 20/month = 240/year
Lost revenue = 240 × ₴800 = ₴192,000/year
Carrying Cost Percentage
Формула:
Carrying Cost % = (Total Carrying Costs / Average Inventory Value) × 100%
Components:
- Storage: ₴50,000
- Insurance: ₴10,000
- Labor: ₴80,000
- Obsolescence: ₴20,000
- Opportunity cost: ₴40,000 Total: ₴200,000
Average Inventory: ₴1,000,000
Carrying Cost % = (₴200,000 / ₴1,000,000) × 100% = 20%
Benchmark: 20-30% typical.
Insight: Кожна гривня inventory коштує 20 копійок на рік у carrying costs.
Inventory Accuracy
Формула:
Inventory Accuracy = (Number of Accurate Counts / Total Items Counted) × 100%
Target: >98%
Methods to improve:
- Cycle counting (регулярні часткові інвентаризації)
- Barcode scanning
- Real-time system updates
- Root cause analysis discrepancies
Fill Rate
Формула:
Fill Rate = (Orders Fulfilled Completely / Total Orders) × 100%
Приклад:
- 950 orders fulfilled повністю
- 1,000 total orders
Fill Rate = 95%
Target: >95%
Fill rate відрізняється від stockout rate – fill rate про повні замовлення, stockout про окремі items.
Comprehensive KPI Dashboard
| KPI | Formula | Current | Target | Status |
|---|---|---|---|---|
| Inventory Turnover | COGS / Avg Inventory | 6.2 | 5-7 | ✅ Good |
| DSI | (Avg Inv / COGS) × 365 | 59 days | <90 | ✅ Good |
| Stockout Rate | Stockouts / Total Orders | 3.2% | <2% | ⚠️ Needs improvement |
| Fill Rate | Complete Orders / Total | 94% | >95% | ⚠️ Close |
| Carrying Cost % | Carry Cost / Avg Inv | 22% | 20-30% | ✅ Good |
| Inventory Accuracy | Accurate / Total Counts | 97% | >98% | ⚠️ Close |
Multi-Channel Inventory Management
Продаж через multiple channels (власний сайт, маркетплейси, соцмережі, офлайн) створює complexity у inventory management.
Challenge: Overselling
Scenario:
- 10 units у stock
- 5 sold на Rozetka
- 4 sold на власному сайті
- 3 sold на Prom.ua
- Total sold: 12 units (більше ніж є!)
Result: 2 customers отримають cancellation → негативний досвід.
Синхронізація Запасів Across Platforms
Стратегії:
1. Real-time synchronization (найкращий спосіб)
- Central inventory system
- API integration з всіма channels
- Sale на channel A → instant update на channels B, C, D
2. Reserved inventory per channel
- 10 units total → allocate 5 для website, 3 для marketplace, 2 buffer
- Простіше, але less efficient (can have stock на одному channel while stockout на іншому)
3. Manual updates (найгірший)
- Prone to errors
- Lag time
- Scalability issues
Centralized vs Distributed Inventory
Centralized Inventory:
One warehouse serves all channels.
Pros:
- Single inventory pool (efficient utilization)
- Simpler management
- Lower total inventory needed
Cons:
- Shipping times longer для distant customers
- Higher shipping costs
Distributed Inventory:
Multiple warehouses у різних регіонах.
Pros:
- Faster shipping (closer to customers)
- Lower shipping costs
- Redundancy (якщо один warehouse issues)
Cons:
- More complex (синхронізація між warehouses)
- Higher total inventory needed (safety stock × locations)
- Риски stock imbalances
Decision factors:
- Geography of customers
- Shipping speed expectations
- Products (heavy items benefit більше від distributed)
- Sales volume (need sufficient volume для justify multiple warehouses)
Inventory Allocation Strategies
Коли multiple channels compete за limited stock:
Priority-based:
- VIP customers → highest priority
- Own website → higher margin → priority над marketplace
- Pre-orders → guaranteed allocation
Velocity-based:
- Allocate більше до fast-selling channels
- Reallocate від slow channels
Profit-based:
- Channel з вищою margin отримує priority allocation
Фінансовий Вплив Inventory Decisions
Inventory рішення мають profound фінансовий impact на бізнес.
Working Capital Tied in Inventory
Приклад:
E-commerce бізнес з ₴500,000 у inventory.
Opportunity cost:
Якщо ці ₴500,000 інвестувати в:
- Marketing (10-20% ROMI) → ₴50,000-100,000 додаткового profit
- New products → розширення асортименту
- Technology → автоматизація
Trade-off: Низький inventory → less tied capital → flexibility, але higher stockout risk.
Storage Costs Detail
Monthly warehouse costs:
For 100 m² warehouse:
- Rent: ₴20,000 (₴200/m²)
- Utilities: ₴3,000
- Security: ₴2,000
- Insurance: ₴1,500
- Equipment: ₴2,500
- Total: ₴29,000/month = ₴348,000/year
If average inventory value: ₴1,000,000
Storage as % of inventory: 35%
Obsolescence Risk
Products can become obsolete через:
- Technology advancement (electronics)
- Fashion trends (apparel)
- Seasonality (winter coats у spring)
- Expiry dates (food, cosmetics)
Markdown strategy:
| Weeks in Stock | Markdown | Sell-Through Target |
|---|---|---|
| 0-4 weeks | 0% | Normal |
| 5-8 weeks | 10% | Accelerate |
| 9-12 weeks | 25% | Clear faster |
| 13+ weeks | 40-50% | Liquidate |
Financial impact:
₴100,000 inventory sitting >13 weeks:
- Cost: ₴60,000
- Sell at 50% off: ₴50,000
- Loss: ₴10,000 + carrying costs
Financial Modeling
Scenario Analysis:
| Scenario | Avg Inventory | Turnover | Carrying Cost | Stockout Cost | Total Cost |
|---|---|---|---|---|---|
| Conservative (high stock) | ₴800,000 | 5x | ₴200,000 | ₴30,000 | ₴230,000 |
| Balanced | ₴500,000 | 8x | ₴125,000 | ₴75,000 | ₴200,000 ✅ |
| Aggressive (low stock) | ₴300,000 | 12x | ₴75,000 | ₴150,000 | ₴225,000 |
Balanced approach optimal – мінімізує total cost.
Типові Помилки та Як Їх Уникнути
Помилка 1: Manual Tracking
Problem: Excel spreadsheets, paper lists, memory.
Consequences:
- Inaccurate data
- Time-consuming updates
- Prone to human error
- No real-time visibility
Solution: Invest у inventory software. ROI окупається через:
- 50-70% reduction у inventory errors
- 30-40% time savings
- Better decision making
Помилка 2: No Demand Forecasting
Problem: Замовляти товар based на gut feeling або "same as last time".
Consequences:
- Frequent stockouts
- Overstocking slow movers
- Poor cash flow
Solution:
- Implement forecasting (навіть simple moving averages краще ніж нічого)
- Review historical data
- Adjust для seasonality та trends
Помилка 3: Ignoring Carrying Costs
Problem: Думати "більше inventory = краще" без розуміння costs.
Consequences:
- Tied capital
- Warehouse space shortage
- Obsolescence losses
Solution:
- Calculate actual carrying cost %
- Set target inventory turnover
- ABC analysis для prioritize high-value items
Помилка 4: Poor Supplier Relationships
Problem: Transactional approach з постачальниками, no communication.
Consequences:
- Unreliable lead times
- Quality issues
- No flexibility при problems
- Higher costs
Solution:
- Build strategic partnerships з key suppliers
- Regular communication
- Share forecasts
- Negotiate better terms (payment, lead time, minimums)
Помилка 5: Lack of Safety Stock
Problem: Tримати exact amount needed, no buffer.
Consequences:
- Stockouts від minor demand spike або затримки
- Lost sales
- Customer dissatisfaction
Solution:
- Calculate appropriate safety stock levels
- Higher safety stock для high-value customers
- Review та adjust based на actual performance
Помилка 6: One-Size-Fits-All Approach
Problem: Same inventory strategy для всіх products.
Consequences:
- Over-investment у low-value items
- Under-investment у high-value items
- Inefficient capital allocation
Solution:
- ABC analysis
- Tailored strategies для different categories
- Focus resources where they matter most
Inventory Management для Різних Типів Бізнесу
High-Volume Low-Margin (FMCG, Grocery)
Characteristics:
- Fast turnover (10-15x/year)
- Thin margins (5-15%)
- High stockout cost (customers won't wait)
Strategy:
- JIT або near-JIT
- Automated reordering
- Strong supplier partnerships
- Minimal safety stock (швидке поповнення)
- Sophisticated forecasting
Example: Online grocery – can't afford stockouts on milk, but також can't overstock perishables.
Low-Volume High-Margin (Luxury, Jewelry)
Characteristics:
- Slow turnover (2-4x/year)
- High margins (50-70%+)
- Lower stockout cost (customers willing to wait)
Strategy:
- Made-to-order або pre-order models
- Smaller inventory
- Higher safety stock % (can afford carrying cost)
- Focus on exclusivity
Example: Custom jewelry – majority made на замовлення, small inventory для showcase.
Seasonal Businesses (Fashion, Gifts, Outdoor Gear)
Characteristics:
- Extreme demand variation
- Short selling window
- High obsolescence risk
Strategy:
- Pre-season inventory build-up
- Aggressive in-season promotions
- End-of-season liquidation
- Conservative safety stock (don't want leftovers)
- Careful forecasting based на previous seasons
Example: Swimwear – 80% sales у April-July, must clear stock by August.
Made-to-Order (Furniture, Custom Products)
Characteristics:
- No finished goods inventory
- Long lead times acceptable
- High customization
Strategy:
- Raw materials inventory
- Component inventory
- Customer prepayment
- Supplier relationships critical
Example: Custom furniture – держать wood, fabrics, hardware, але not finished pieces.
Multi-Brand Retailers (Marketplaces, Multi-brand stores)
Characteristics:
- Wide SKU variety (1000+ SKUs)
- Different suppliers/brands
- Complex inventory mix
Strategy:
- Dropshipping для long-tail
- Owned inventory для best sellers (category A)
- Centralized inventory system
- Automated supplier integration
Example: Fashion multi-brand retailer – stock 20% top brands owned, 80% dropship.
FAQ
1. Скільки запасу потрібно тримати?
Залежить від:
Service level target:
- 95% → 1.65 × σ demand × √lead time
- 98% → 2.05 × σ demand × √lead time
Turnover target:
Якщо target turnover 8x/year:
Target Inventory = Annual COGS / 8
For ₴4M COGS: Target = ₴500,000 average inventory
ABC approach:
- Category A: 30-45 days supply
- Category B: 15-30 days supply
- Category C: 7-15 days supply
General rule: Enough для cover lead time + safety stock, але not більше 90 days supply (except seasonal pre-build).
2. Як розрахувати reorder point?
Step-by-step:
Step 1: Calculate average daily sales
Avg Daily Sales = Monthly Sales / 30
Step 2: Determine lead time у днях
Example: 10 days
Step 3: Calculate safety stock
Safety Stock = (Max Daily Sales × Max Lead Time) - (Avg Daily Sales × Avg Lead Time)
Step 4: Calculate reorder point
Reorder Point = (Avg Daily Sales × Lead Time) + Safety Stock
Example calculation:
- Avg sales: 50/day
- Max sales: 75/day
- Avg lead time: 10 days
- Max lead time: 14 days
Safety Stock = (75 × 14) - (50 × 10) = 1,050 - 500 = 550 units

Reorder Point = (50 × 10) + 550 = 1,050 units
Set alert: When stock hits 1,050 → create PO.
3. Dropshipping vs Own Inventory – що обрати?
Decision Matrix:
| Factor | Dropship | Own Inventory |
|---|---|---|
| Initial Investment | Low (₴0) | High (₴50K-500K+) |
| Margins | Low (20-30%) | High (40-60%) |
| Control | Low | High |
| Shipping Speed | Slower (5-7 days) | Faster (1-2 days) |
| Scalability | High (unlimited SKUs) | Limited (warehouse space) |
| Risk | Low (no inventory risk) | High (obsolescence) |
Recommendation:
Start with dropshipping якщо:
- Limited capital (<₴100K)
- Testing products/market
- Wide assortment strategy
- Willing to accept lower margins
Move to own inventory when:
- Proven bestsellers identified
- Sufficient capital
- Need faster shipping
- Want higher margins
- Building brand
Hybrid: Best approach – own inventory для top 20% SKUs (80% revenue), dropship решту.
4. Яке програмне забезпечення використовувати?
For Small Business (<100 orders/month):
- Spreadsheets (Google Sheets) + manual tracking
- Cost: Free
- Limitation: Scales poorly, error-prone
For Growing Business (100-500 orders/month):
- E-commerce native (Shopify Inventory, WooCommerce Stock)
- Standalone: TradeGecko, Cin7 Lite
- Cost: ₴1,000-3,000/month
- Features: Basic forecasting, reorder points, multi-location
For Scale-up (500+ orders/month):
- Advanced standalone: Cin7, Katana, Ordoro
- ERP: NetSuite, SAP
- LetsCommerce: Built-in advanced inventory module
- Cost: ₴5,000-30,000/month
- Features: Advanced forecasting, multi-channel, automation, analytics
Selection criteria:
- Integration з вашою e-commerce platform
- Scalability (can handle growth)
- Multi-location support (якщо потрібно)
- API availability (для custom integrations)
- Mobile app (warehouse staff)
- Cost (% of revenue reasonable)
- Support quality
5. Як зменшити carrying costs?
Tactics:
1. Improve turnover:
- Better forecasting → less excess inventory
- ABC analysis → focus на high-turnover items
- Clearance sales для slow movers
2. Negotiate warehouse costs:
- Shared warehousing (кооперація)
- 3PL warehouses (pay per unit stored)
- Relocate до cheaper location
3. Reduce safety stock smartly:
- Improve supplier reliability → need less buffer
- Better forecasting → less uncertainty
- Category C items → minimal safety stock
4. Liquidate dead stock:
- Identify items >90 days no sales
- Aggressive discounts (30-50%)
- Donate (tax write-off) або bulk sale
5. Just-in-Time elements:
- Frequent small orders instead of large quarterly
- Vendor-managed inventory для key suppliers
Impact:
Reducing inventory від ₴800K до ₴500K:
- Savings: ₴300K × 25% carrying cost = ₴75K/year
- Plus: ₴300K freed capital для other uses
6. Що робити з slow-moving inventory?
Identification:
Slow-moving = >90 days у stock без продажу або turnover <2x/year.
Actions:
1. Promotion/Discount:
- 20-30% discount email campaign
- Bundle зі швидкообіговими items
- Add-on sale (buy X get slow mover at discount)
2. Repositioning:
- Better product photos/description
- Different category placement
- Cross-sell recommendations
3. Liquidation:
- Bulk sale до liquidators (10-30% of cost)
- Outlet stores
- Flash sale platforms
4. Donation:
- Charitable donation
- Tax write-off (може частково offset loss)
5. Return to supplier:
- Negotiate return (якщо можливо)
- Exchange для faster-moving items
Prevention:
- Test products у small quantities перед bulk order
- Monitor sell-through rate weekly
- Set automatic alerts для items slower than target
- ABC analysis → avoid heavy investment у C-category
7. Як автоматизувати reordering?
Automation levels:
Level 1: Alerts
- System sends alert коли stock hits reorder point
- Human reviews та manually creates PO
- Effort: Low automation
- Control: High human oversight
Level 2: Draft PO
- System creates draft PO automatically
- Human reviews та approves
- Effort: Medium automation
- Control: Human approval gate
Level 3: Fully Automated
- System creates and sends PO до supplier automatically
- Only exception handling requires human
- Effort: High automation
- Control: Trust system + monitoring
Implementation:
Prerequisites:
- Inventory software з reorder point functionality
- Accurate historical sales data
- Reliable supplier integration (API або EDI)
- Agreed terms з supplier (auto-PO acceptance)
Setup:
- Configure reorder points для кожного SKU
- Set EOQ або standard order quantities
- Define rules:
- Min/max order quantities
- Order frequency limits
- Approval thresholds (auto approve <₴50K, human >₴50K)
- Test у pilot mode (alerts only)
- Monitor performance (stockouts, overstock)
- Adjust parameters based на actual performance
- Scale до full automation
Benefits:
- 80% reduction у time spent на ordering
- Fewer stockouts (faster response)
- Fewer human errors
- Consistent ordering
Integration з Автоматизація маркетингу дозволяє також автоматизувати:
- Back-in-stock notifications клієнтам
- Low stock alerts для promotions
- Coordinated campaigns
8. Як балансувати inventory між каналами продажу?
Challenge:
Selling на website, Rozetka, Prom, Instagram → як розподілити 100 units у stock?
Approaches:
1. Dynamic Real-Time Sync (Best)
- Central inventory pool (100 units)
- All channels draw з same pool
- Sale на будь-якому channel → instant update всюди
- Pros: Maximum efficiency, no overselling
- Cons: Requires robust integration
2. Channel-Reserved (Simple)
- Pre-allocate: 50 website, 30 Rozetka, 20 Prom
- Each channel independent
- Pros: Simple, no integration complexity
- Cons: Inefficient (stock-out на одному channel while available на іншому)
3. Priority-Based (Balanced)
- Primary channel (website) gets priority
- Other channels share remaining
- Auto-rebalance weekly based на velocity
- Pros: Balance simplicity та efficiency
- Cons: Some manual management
Best Practice:
Start simple (reserved) → evolve до dynamic sync as scale.
Tools needed:
- Multi-channel inventory software
- API integrations з всіма selling channels
- Real-time sync capability
Monitoring:
Track по каналах:
- Stockout rate
- Inventory utilization %
- Sales velocity
Adjust allocation based на performance.
Висновок
Управління запасами – це не просто operational функція, це strategic capability, що напряму впливає на фінансове здоров'я, customer satisfaction, scalability e-commerce бізнесу.
Ключові takeaways:
- Balance is key – між service level та carrying costs, між stockouts та overstocking
- Data-driven decisions – використовувати математичні моделі (EOQ, safety stock) замість gut feeling
- ABC prioritization – не всі товари рівні, фокусувати ресурси на високоцінних
- Technology enablement – software та automation критичні для scaling
- Continuous optimization – регулярно review metrics, adjust strategies
- Multi-channel complexity – потребує sophisticated systems та synchronization
ROI Inventory Optimization:
Properly managed inventory provides:
- Cash flow improvement: Less capital tied up
- Cost reduction: Lower carrying costs (20-30% savings)
- Revenue protection: Fewer stockouts (5-15% revenue impact)
- Customer satisfaction: Consistent availability
- Scalability: Foundation для growth
LetsCommerce Platform Capabilities:
LetsCommerce надає comprehensive inventory management tools:
- Real-time tracking across multiple locations та channels
- Automated reordering з smart reorder points
- ABC analysis вбудований у analytics
- Demand forecasting using historical data та ML
- Multi-channel sync prevents overselling
- Integration з логістичними операторами
- Mobile app для warehouse management
- Automated alerts для low stock, slow movers
- Returns integration з системою управління поверненнями
Getting Started:
- Audit current state – використати чек-лист з статті
- Calculate baseline metrics – turnover, DSI, carrying costs
- Implement ABC analysis – prioritize high-value items
- Choose software – based на business size та needs
- Set up automation – start з alerts, progress до auto-reordering
- Monitor и iterate – continuous improvement
Inventory management – це journey, not destination. As бізнес grows, стратегії evolve. Початок з basics (tracking, reorder points) та поступова sophistication (forecasting, automation, multi-location) – proven path до operational excellence.
Чек-лист Inventory Management Audit
Data та Tracking:
- Inventory system у місці (не просто spreadsheets)
- Real-time stock visibility
- Accurate SKU structure
- Barcode система implemented
- Integration з e-commerce platform
Planning та Forecasting:
- Demand forecasting process exists
- Historical sales data analyzed
- Seasonality factors identified
- Reorder points calculated для кожного SKU
- Safety stock levels defined
Operational Efficiency:
- ABC analysis performed
- Different strategies для A/B/C items
- Warehouse organized efficiently
- FIFO enforced (for applicable products)
- Picking paths optimized
Financial Management:
- Carrying costs calculated
- Inventory turnover tracked monthly
- Dead stock identification process
- Working capital impact understood
- Target turnover defined
Supplier Management:
- Lead times documented
- Supplier reliability tracked
- Strategic partnerships для category A
- Backup suppliers identified
- Terms negotiated (minimums, payment, returns)
Multi-Channel (if applicable):
- Inventory sync across channels
- Overselling prevention
- Channel allocation strategy
- Performance tracking по channels
Technology:
- Automated reordering configured
- Alerts для low stock
- Mobile capabilities для warehouse
- Integration with shipping/logistics
- Reporting та analytics dashboards
Metrics Monitoring:
- Inventory turnover calculated monthly
- Stockout rate tracked
- Fill rate monitored
- Inventory accuracy >98%
- DSI below target
Пов'язані статті
- Доставка та логістика – як lead time та fulfillment integration впливають на inventory management, warehouse logistics, cross-docking strategies
- Customer Lifetime Value – вплив stockouts на retention та LTV, важливість inventory availability для customer satisfaction
- Управління поверненнями – reverse logistics, обробка returned inventory, restocking strategies, defective inventory handling
- Автоматизація маркетингу – автоматизація back-in-stock notifications, low inventory alerts, coordinated promotions
- Email маркетинг – back-in-stock email campaigns, inventory-driven segmentation, restock announcements

Готові почати продавати?
Запустіть свій інтернет-магазин сьогодні з LetsCommerce.